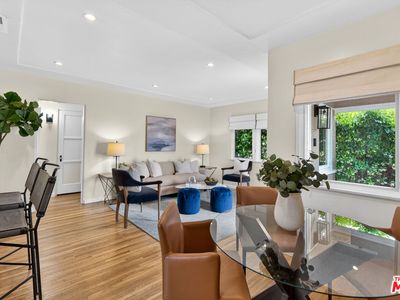
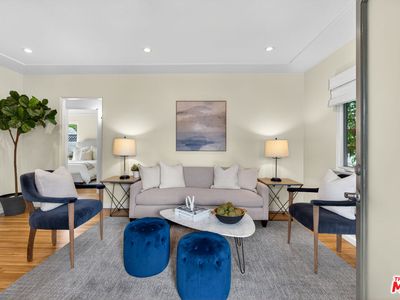
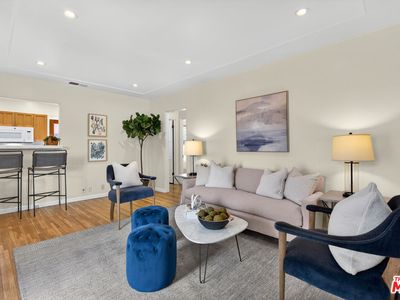
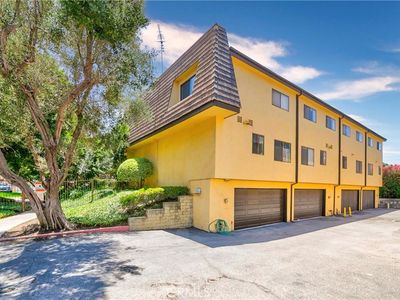
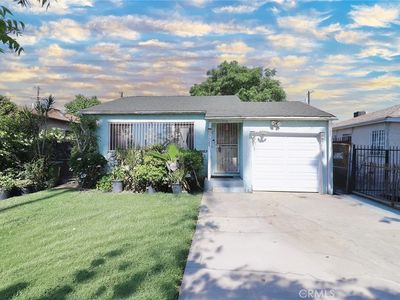
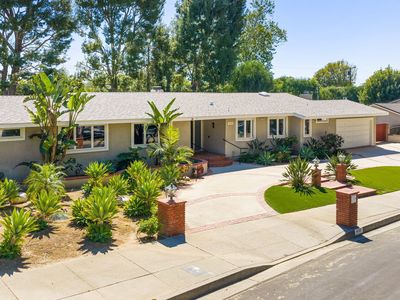
2822 11th StSanta MonicaCA90405
INVESTMENT ANALYSIS
Investment Verdict
Appreciation PlayThe investment thesis at 2822 11th St, Santa Monica, CA, 90405 in Santa Monica is capital appreciation. Rental yield 4.11%. The 4.11% gross yield at $1,585,000 falls below cash-flow thresholds, but 5% annual value growth is forecast to deliver $437,906 in additional equity by year five, an equity gain that can outpace many higher-yield markets. Ziffy Mortgage finances appreciation-play assets via DSCR (0.76) without U.S. credit history; structure with a larger down payment to optimise coverage. Total projected return: $319,065.
| This Property | City Avg | |
|---|---|---|
| Gross Rental Yield | 4.1% | 5.2% |
| Monthly Cash Flow | $(4,381) | $1,500 |
City averages based on Santa Monica market data in our database. Property projections are estimates.
DSCR Rental Loan Qualification
Qualifies using the property's rental income, not your personal income.
- ✓No W-2, pay stubs, or tax returns needed
- ✓Rental income qualifies you
- ✓Built for real estate investors
| Monthly Rental Income | $5,424 |
| Total Monthly Debt Service | $9,174 |
| DSCR Ratio | 0.59x |
Ziffy Mortgage typically prefers a DSCR of 1.0+, but in some cases you may qualify with a DSCR below 1. To explore if this deal qualifies for an investment mortgage, book time with your loan officer →
Estimates assume 6.0% rate / 30-yr fixed, 30% down, 1% tax, 0.5% insurance. Not a commitment to lend.
Single Family
Built in 1939
2,870 sqft lot
$N/A/sqft
No HOA
Neighborhood Data
Neighborhood data shown for ZIP Code: 90405, Santa Monica, CA area.
Housing Distribution
Housing Statistics
| Category | Value |
|---|---|
| Total HU (Housing Units) | 15,200 (100%) |
| Owner Occupied HU | 4,571 (30.1%) |
| Renter Occupied HU | 9,417 (62.0%) |
| Vacant Housing Units | 1,212 ( 8.0%) |
| Median Home Value | $1,782,468 |
| Average Home Value | $1,716,955 |
Housing Distribution
Address Breakdown
Residential
15,252
Single Family
6,537
Multi-Family
8,715
Businesses
1,432


Nearby investment properties with comparable rents
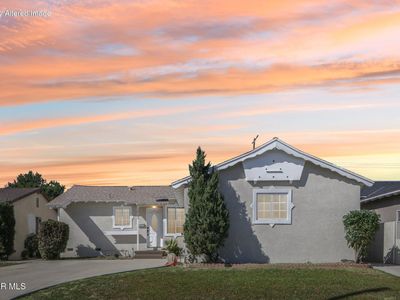
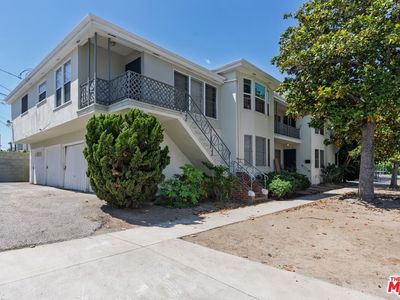
Nearby investment properties with comparable prices

Ziffy AI Summary
A quick, investor-focused snapshot highlighting income strength, yield potential.
| Key metrics | Value |
|---|---|
| Price | $399,900 |
| Est. Rent | $3,200/mo |
| ROI | 18% |
- Attractive rent-to-price ratio for income stability
- Good fit for DSCR financing with healthy coverage
Single Family
Built in 1939
2,870 sqft lot
$N/A/sqft
No HOA
Neighborhood Data
Neighborhood data shown for ZIP Code: 90405, Santa Monica, CA area.
Housing Distribution
Housing Statistics
| Category | Value |
|---|---|
| Total HU (Housing Units) | 15,200 (100%) |
| Owner Occupied HU | 4,571 (30.1%) |
| Renter Occupied HU | 9,417 (62.0%) |
| Vacant Housing Units | 1,212 ( 8.0%) |
| Median Home Value | $1,782,468 |
| Average Home Value | $1,716,955 |
Housing Distribution
Address Breakdown
Residential
15,252
Single Family
6,537
Multi-Family
8,715
Businesses
1,432
Nearby investment properties with comparable rents
Nearby investment properties with comparable prices
Listed by: N/A • N/A
Mls Name: CLAW
Mls ID: #26832877