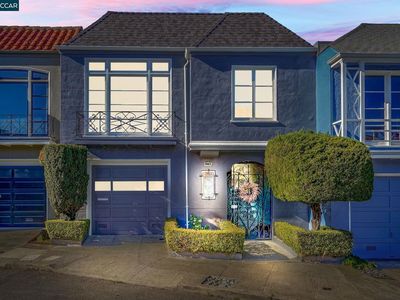
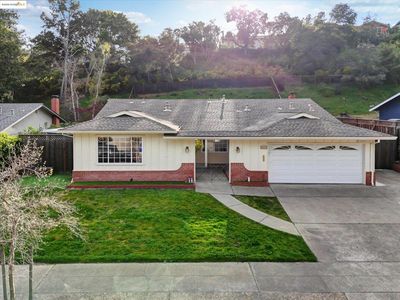
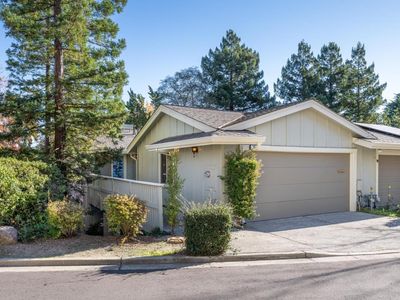
276 Ewing TerSan FranciscoCA94118
INVESTMENT ANALYSIS
Investment Verdict
Appreciation PlayMarkets with strong demand fundamentals often produce low-yield, high-appreciation assets. 276 Ewing Ter, San Francisco, CA, 94118 in San Francisco fits: $1,699,000, 5.2% gross yield, and a projected 5% annual appreciation rate adding $469,402 in value within five years. Rental yield 5.2%. The narrow rent-to-debt spread is the trade-off for market growth. Ziffy Mortgage's DSCR loan (0.96) finances non-U.S. buyers without personal income documentation; optimise coverage with a 30–35% down payment. $15,648/yr in principal paydown and $469,402 in appreciation project a total return of $441,939.
| This Property | City Avg | |
|---|---|---|
| Gross Rental Yield | 5.2% | 4.5% |
| Monthly Cash Flow | $(3,144) | $2,800 |
City averages based on San Francisco market data in our database. Property projections are estimates.
DSCR Rental Loan Qualification
Qualifies using the property's rental income, not your personal income.
- ✓No W-2, pay stubs, or tax returns needed
- ✓Rental income qualifies you
- ✓Built for real estate investors
| Monthly Rental Income | $7,367 |
| Total Monthly Debt Service | $9,834 |
| DSCR Ratio | 0.75x |
Ziffy Mortgage typically prefers a DSCR of 1.0+, but in some cases you may qualify with a DSCR below 1. To explore if this deal qualifies for an investment mortgage, book time with your loan officer →
Estimates assume 6.0% rate / 30-yr fixed, 30% down, 1% tax, 0.5% insurance. Not a commitment to lend.
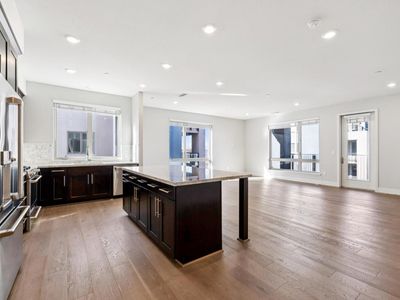
Single Family
Built in 1940
2,178 sqft lot
$N/A/sqft
No HOA
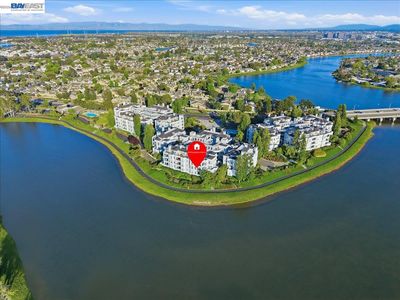
Neighborhood Data
Neighborhood data shown for ZIP Code: 94118, San Francisco, CA area.
Housing Distribution
Housing Statistics
| Category | Value |
|---|---|
| Total HU (Housing Units) | 18,983 (100%) |
| Owner Occupied HU | 5,824 (30.7%) |
| Renter Occupied HU | 11,565 (60.9%) |
| Vacant Housing Units | 1,594 ( 8.4%) |
| Median Home Value | $1,980,876 |
| Average Home Value | $1,770,504 |
Housing Distribution
Address Breakdown
Residential
17,881
Single Family
9,029
Multi-Family
8,852
Businesses
1,423


Nearby investment properties with comparable rents
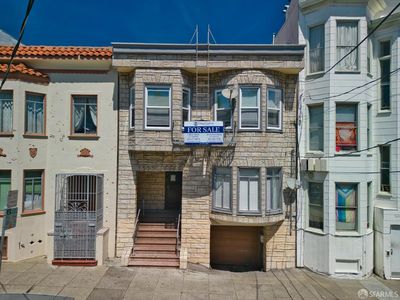
Nearby investment properties with comparable prices

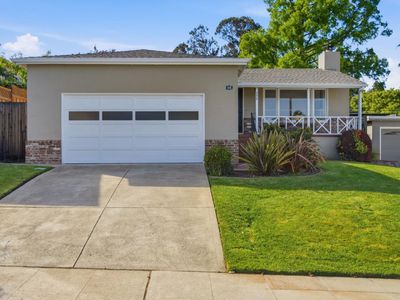
Ziffy AI Summary
A quick, investor-focused snapshot highlighting income strength, yield potential.
| Key metrics | Value |
|---|---|
| Price | $399,900 |
| Est. Rent | $3,200/mo |
| ROI | 18% |
- Attractive rent-to-price ratio for income stability
- Good fit for DSCR financing with healthy coverage
Single Family
Built in 1940
2,178 sqft lot
$N/A/sqft
No HOA
Neighborhood Data
Neighborhood data shown for ZIP Code: 94118, San Francisco, CA area.
Housing Distribution
Housing Statistics
| Category | Value |
|---|---|
| Total HU (Housing Units) | 18,983 (100%) |
| Owner Occupied HU | 5,824 (30.7%) |
| Renter Occupied HU | 11,565 (60.9%) |
| Vacant Housing Units | 1,594 ( 8.4%) |
| Median Home Value | $1,980,876 |
| Average Home Value | $1,770,504 |
Housing Distribution
Address Breakdown
Residential
17,881
Single Family
9,029
Multi-Family
8,852
Businesses
1,423
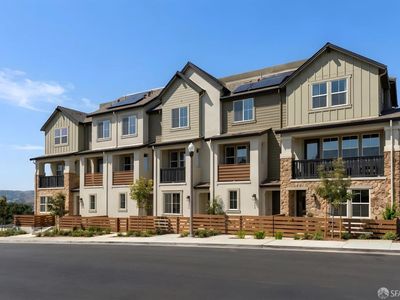
Nearby investment properties with comparable rents
Nearby investment properties with comparable prices
Listed by: Terrylynn Fisher • Dudum Real Estate Group
Mls Name: bridgeMLS/CCAR/Bay East AOR
Mls Provider:
Mls ID: #41083491
Disclaimer: Bay East 2025. CCAR 2025. bridgeMLS 2025. Information Deemed Reliable But Not Guaranteed. This information is being provided by the Bay East MLS, or CCAR MLS, or bridgeMLS. The listings presented here may or may not be listed by the Broker/Agent operating this website. This information is intended for the personal use of consumers and may not be used for any purpose other than to identify prospective properties consumers may be interested in purchasing. Data last updated at 2025-02-12 09:20:53 PST.