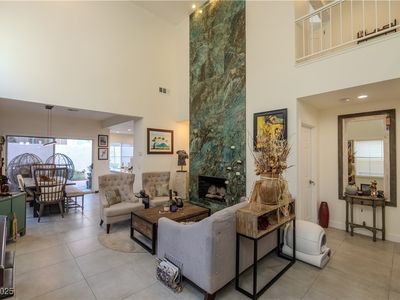
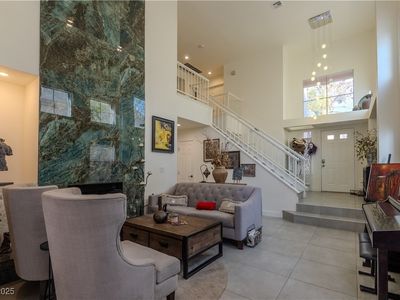
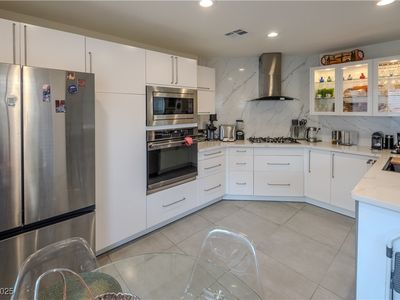
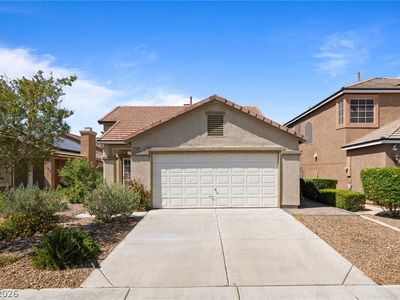
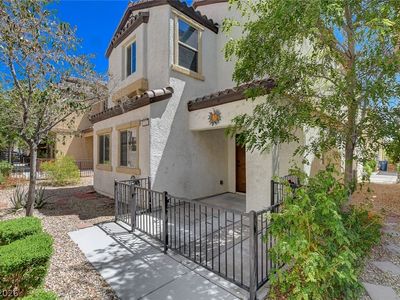
2649 Golden Sands DrLas VegasNV89128
INVESTMENT ANALYSIS
Investment Verdict
Steady Equity BuilderNot flashy, but dependably profitable, 2649 Golden Sands Dr, Las Vegas, NV, 89128 in Las Vegas is listed at $434,900 and delivers $2,754/mo in rent and $241/mo in net monthly cash flow. The 7.6% yield and 1.41 DSCR provide the underwriting comfort Ziffy Mortgage needs to approve a DSCR loan without W-2 or tax-return documentation. Projected 5% annual appreciation adds $120,155 over five years, and $4,005/yr in principal reduction supplements cash return. Total projected cumulative return: $179,614.
| This Property | City Avg | |
|---|---|---|
| Gross Rental Yield | 7.6% | 5.2% |
| Monthly Cash Flow | $241 | $850 |
City averages based on Las Vegas market data in our database. Property projections are estimates.
DSCR Rental Loan Qualification
Qualifies using the property's rental income, not your personal income.
- ✓No W-2, pay stubs, or tax returns needed
- ✓Rental income qualifies you
- ✓Built for real estate investors
| Monthly Rental Income | $2,754 |
| Total Monthly Debt Service | $2,340 |
| DSCR Ratio | 1.18x |
Ziffy Mortgage: Your DSCR most likely meets our 1.0+ requirement, so you'll most probably qualify for our standard DSCR investment loan program. To pre-qualify, book time with your loan officer →
Estimates assume 6.0% rate / 30-yr fixed, 30% down, 1% tax, 0.5% insurance. Not a commitment to lend.
Townhouse
Built in 1990
2,613 sqft lot
$N/A/sqft
No HOA
Neighborhood Data
Neighborhood data shown for ZIP Code: 89128, Las Vegas, NV area.
Housing Distribution
Housing Statistics
| Category | Value |
|---|---|
| Total HU (Housing Units) | 17,187 (100%) |
| Owner Occupied HU | 8,552 (49.8%) |
| Renter Occupied HU | 7,765 (45.2%) |
| Vacant Housing Units | 870 ( 5.1%) |
| Median Home Value | $425,266 |
| Average Home Value | $473,431 |
Housing Distribution
Address Breakdown
Residential
16,539
Single Family
10,723
Multi-Family
5,816
Businesses
843


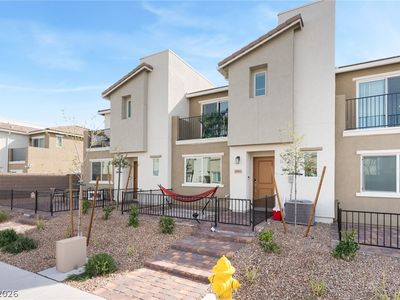
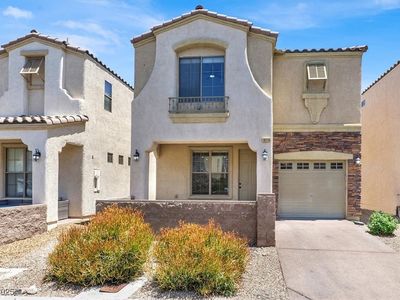
Nearby investment properties with comparable rents
Nearby investment properties with comparable prices

Ziffy AI Summary
A quick, investor-focused snapshot highlighting income strength, yield potential.
| Key metrics | Value |
|---|---|
| Price | $399,900 |
| Est. Rent | $3,200/mo |
| ROI | 18% |
- Attractive rent-to-price ratio for income stability
- Good fit for DSCR financing with healthy coverage
Townhouse
Built in 1990
2,613 sqft lot
$N/A/sqft
No HOA
Neighborhood Data
Neighborhood data shown for ZIP Code: 89128, Las Vegas, NV area.
Housing Distribution
Housing Statistics
| Category | Value |
|---|---|
| Total HU (Housing Units) | 17,187 (100%) |
| Owner Occupied HU | 8,552 (49.8%) |
| Renter Occupied HU | 7,765 (45.2%) |
| Vacant Housing Units | 870 ( 5.1%) |
| Median Home Value | $425,266 |
| Average Home Value | $473,431 |
Housing Distribution
Address Breakdown
Residential
16,539
Single Family
10,723
Multi-Family
5,816
Businesses
843
Nearby investment properties with comparable rents
Nearby investment properties with comparable prices