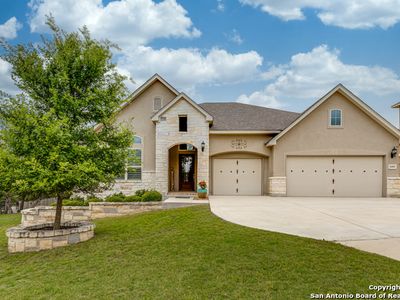
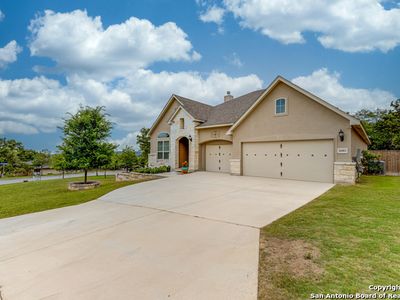
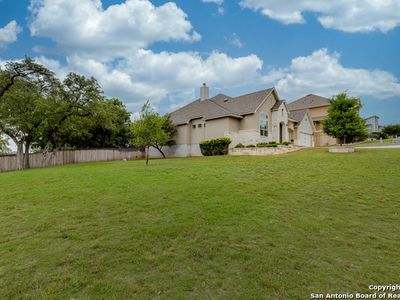
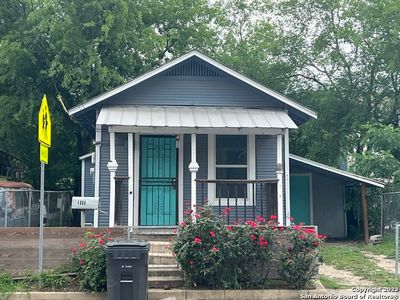
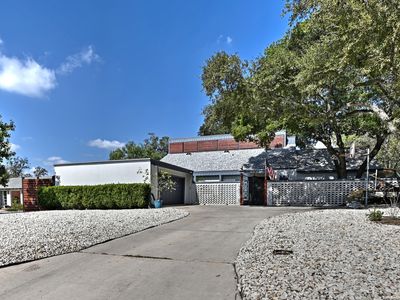
26003 Tivoli MeadowSan AntonioTX78260
INVESTMENT ANALYSIS
Investment Verdict
Strong Cash FlowDay-one income is the story at 26003 Tivoli Meadow, San Antonio, TX, 78260 in San Antonio. Priced at $665,000, it generates $6,220/mo in gross rent and $1,410/mo in net monthly cash flow, a 11.22% yield that comfortably supports the 2.08 DSCR needed for Ziffy Mortgage's no-W2 DSCR mortgage. Projected annual cash flow: $16,920. Five-year appreciation: $183,727. Equity from principal paydown: $6,125/yr. Total projected cumulative return: $345,989.
| This Property | City Avg | |
|---|---|---|
| Gross Rental Yield | 11.2% | 5.8% |
| Monthly Cash Flow | $1,410 | $450 |
City averages based on San Antonio market data in our database. Property projections are estimates.
DSCR Rental Loan Qualification
Qualifies using the property's rental income, not your personal income.
- ✓No W-2, pay stubs, or tax returns needed
- ✓Rental income qualifies you
- ✓Built for real estate investors
| Monthly Rental Income | $6,220 |
| Total Monthly Debt Service | $4,545 |
| DSCR Ratio | 1.37x |
Ziffy Mortgage: Your DSCR most likely meets our 1.0+ requirement, so you'll most probably qualify for our standard DSCR investment loan program. To pre-qualify, book time with your loan officer →
Estimates assume 6.0% rate / 30-yr fixed, 30% down, 1% tax, 0.5% insurance. Not a commitment to lend.
Single Family
Built in 2016
0.61 Acres lot
$N/A/sqft
$242 quarterly HOA
Neighborhood Data
Neighborhood data shown for ZIP Code: 78260, San Antonio, TX area.
Housing Distribution
Housing Statistics
| Category | Value |
|---|---|
| Total HU (Housing Units) | 15,827 (100%) |
| Owner Occupied HU | 12,013 (75.9%) |
| Renter Occupied HU | 2,891 (18.3%) |
| Vacant Housing Units | 923 ( 5.8%) |
| Median Home Value | $477,115 |
| Average Home Value | $509,391 |
Housing Distribution
Address Breakdown
Residential
14,830
Single Family
13,560
Multi-Family
1,270
Businesses
194


Nearby investment properties with comparable rents
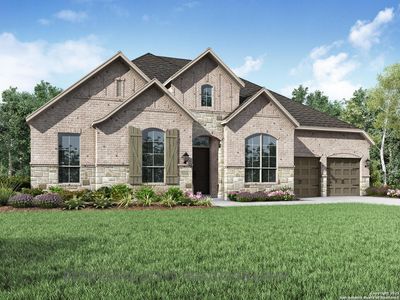
Nearby investment properties with comparable prices


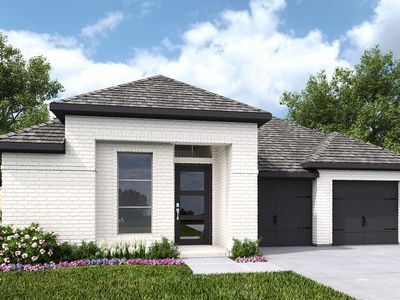

Ziffy AI Summary
A quick, investor-focused snapshot highlighting income strength, yield potential.
| Key metrics | Value |
|---|---|
| Price | $399,900 |
| Est. Rent | $3,200/mo |
| ROI | 18% |
- Attractive rent-to-price ratio for income stability
- Good fit for DSCR financing with healthy coverage
Single Family
Built in 2016
0.61 Acres lot
$N/A/sqft
$242 quarterly HOA
Neighborhood Data
Neighborhood data shown for ZIP Code: 78260, San Antonio, TX area.
Housing Distribution
Housing Statistics
| Category | Value |
|---|---|
| Total HU (Housing Units) | 15,827 (100%) |
| Owner Occupied HU | 12,013 (75.9%) |
| Renter Occupied HU | 2,891 (18.3%) |
| Vacant Housing Units | 923 ( 5.8%) |
| Median Home Value | $477,115 |
| Average Home Value | $509,391 |
Housing Distribution
Address Breakdown
Residential
14,830
Single Family
13,560
Multi-Family
1,270
Businesses
194
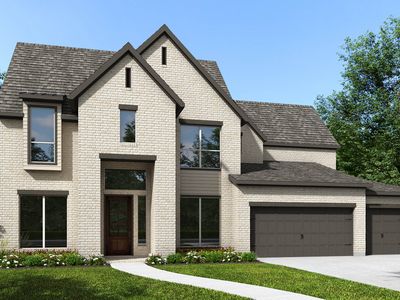
Nearby investment properties with comparable rents
Nearby investment properties with comparable prices