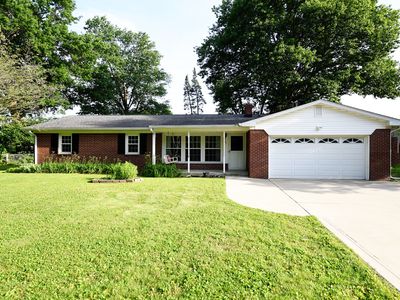
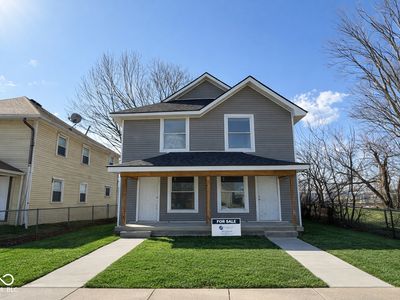
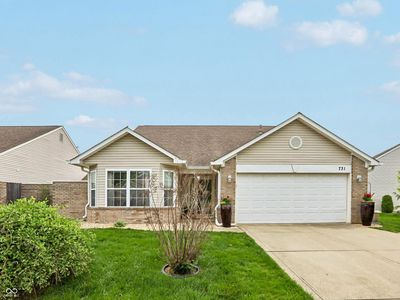
2511 Colony CtIndianapolisIN46280
INVESTMENT ANALYSIS
Investment Verdict
Steady Equity BuilderInvestors who treat current yield as secondary to long-run equity growth will find 2511 Colony Ct, Indianapolis, IN, 46280 in Indianapolis worth modelling. At $340,000 with a 7.52% gross yield, the $2,130/mo rent leaves $89/mo after the $1,529/mo payment, sufficient to cover costs, modest in distribution. Ziffy Mortgage's 1.39 DSCR loan can finance the acquisition without personal income documentation. Appreciation of 5%/yr is projected to add $93,936 by year five; $3,131/yr in principal reduction adds further equity. Total projected return: $134,423.
| This Property | City Avg | |
|---|---|---|
| Gross Rental Yield | 7.5% | 6.8% |
| Monthly Cash Flow | $89 | $450 |
City averages based on Indianapolis market data in our database. Property projections are estimates.
DSCR Rental Loan Qualification
Qualifies using the property's rental income, not your personal income.
- ✓No W-2, pay stubs, or tax returns needed
- ✓Rental income qualifies you
- ✓Built for real estate investors
| Monthly Rental Income | $2,130 |
| Total Monthly Debt Service | $1,906 |
| DSCR Ratio | 1.12x |
Ziffy Mortgage: Your DSCR most likely meets our 1.0+ requirement, so you'll most probably qualify for our standard DSCR investment loan program. To pre-qualify, book time with your loan officer →
Estimates assume 6.0% rate / 30-yr fixed, 30% down, 1% tax, 0.5% insurance. Not a commitment to lend.
Single Family
Built in 1962
0.54 Acres lot
$N/A/sqft
No HOA
Neighborhood Data
Neighborhood data shown for ZIP Code: 46280, Indianapolis, IN area.
Housing Distribution
Housing Statistics
| Category | Value |
|---|---|
| Total HU (Housing Units) | 3,987 (100%) |
| Owner Occupied HU | 2,438 (61.1%) |
| Renter Occupied HU | 1,325 (33.2%) |
| Vacant Housing Units | 224 ( 5.6%) |
| Median Home Value | $415,727 |
| Average Home Value | $436,357 |
Housing Distribution
Address Breakdown
Residential
3,819
Single Family
3,612
Multi-Family
207
Businesses
254


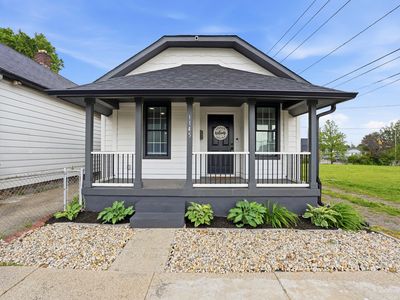
Nearby investment properties with comparable rents
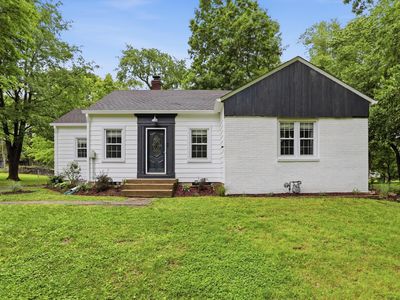
Nearby investment properties with comparable prices
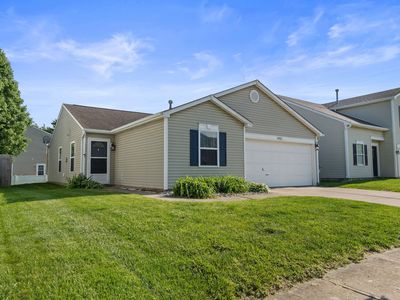

Ziffy AI Summary
A quick, investor-focused snapshot highlighting income strength, yield potential.
| Key metrics | Value |
|---|---|
| Price | $399,900 |
| Est. Rent | $3,200/mo |
| ROI | 18% |
- Attractive rent-to-price ratio for income stability
- Good fit for DSCR financing with healthy coverage
Single Family
Built in 1962
0.54 Acres lot
$N/A/sqft
No HOA
Neighborhood Data
Neighborhood data shown for ZIP Code: 46280, Indianapolis, IN area.
Housing Distribution
Housing Statistics
| Category | Value |
|---|---|
| Total HU (Housing Units) | 3,987 (100%) |
| Owner Occupied HU | 2,438 (61.1%) |
| Renter Occupied HU | 1,325 (33.2%) |
| Vacant Housing Units | 224 ( 5.6%) |
| Median Home Value | $415,727 |
| Average Home Value | $436,357 |
Housing Distribution
Address Breakdown
Residential
3,819
Single Family
3,612
Multi-Family
207
Businesses
254
Nearby investment properties with comparable rents
Nearby investment properties with comparable prices
Listed by: N/A • N/A
Mls Name: MIBOR as distributed by MLS GRID
Mls ID: #22105542