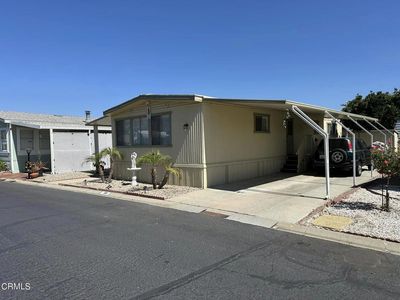
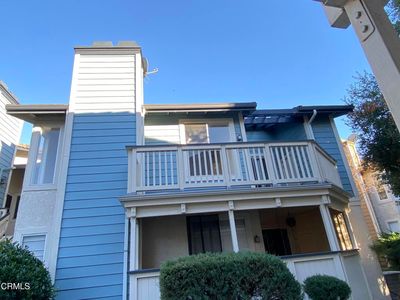
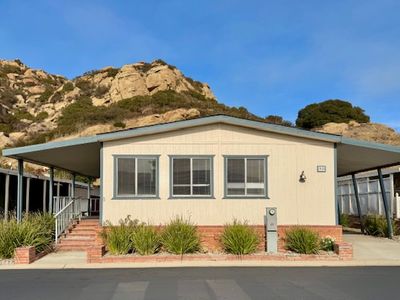
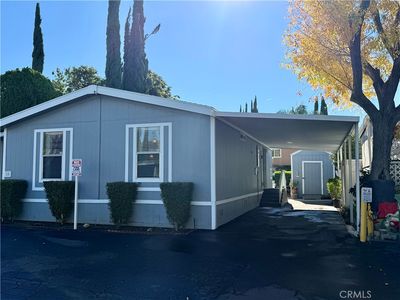
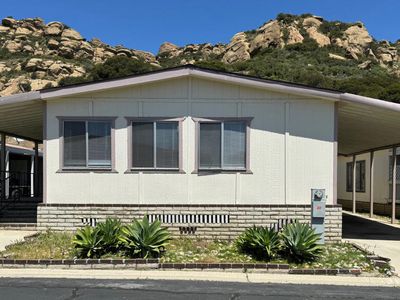
250 E Telegraph Rd SPC 188FillmoreCA93015
INVESTMENT ANALYSIS
Investment Verdict
Strong Cash FlowThe yield at 250 E Telegraph Rd SPC 188, Fillmore, CA, 93015 in Fillmore speaks for itself: 31.6% gross on a $170,000 price, generating $4,476/mo in rent and $3,424/mo in net income after the $764/mo debt service. DSCR 5.86, a wide margin that supports Ziffy Mortgage's DSCR loan without any personal income check. Annual cash flow of $41,092 stacks alongside $46,968 in projected five-year appreciation and $1,566/yr in principal reduction. Projected total cumulative return: $284,880.
| This Property | City Avg | |
|---|---|---|
| Gross Rental Yield | 31.6% | 6.5% |
| Monthly Cash Flow | $3,424 | $400 |
City averages based on Fillmore market data in our database. Property projections are estimates.
DSCR Rental Loan Qualification
Qualifies using the property's rental income, not your personal income.
- ✓No W-2, pay stubs, or tax returns needed
- ✓Rental income qualifies you
- ✓Built for real estate investors
| Monthly Rental Income | $4,476 |
| Total Monthly Debt Service | $984 |
| DSCR Ratio | 4.55x |
Ziffy Mortgage: Your DSCR most likely meets our 1.0+ requirement, so you'll most probably qualify for our standard DSCR investment loan program. To pre-qualify, book time with your loan officer →
Estimates assume 6.0% rate / 30-yr fixed, 30% down, 1% tax, 0.5% insurance. Not a commitment to lend.
Manufactured
Built in 1973
3,770 sqft lot
$N/A/sqft
No HOA
Neighborhood Data
Neighborhood data shown for ZIP Code: 93015, Fillmore, CA area.
Housing Distribution
Housing Statistics
| Category | Value |
|---|---|
| Total HU (Housing Units) | 5,986 (100%) |
| Owner Occupied HU | 3,857 (64.4%) |
| Renter Occupied HU | 1,848 (30.9%) |
| Vacant Housing Units | 281 ( 4.7%) |
| Median Home Value | $652,909 |
| Average Home Value | $708,417 |
Housing Distribution
Address Breakdown
Residential
5,904
Single Family
5,548
Multi-Family
356
Businesses
275


Nearby investment properties with comparable rents
Nearby investment properties with comparable prices

Ziffy AI Summary
A quick, investor-focused snapshot highlighting income strength, yield potential.
| Key metrics | Value |
|---|---|
| Price | $399,900 |
| Est. Rent | $3,200/mo |
| ROI | 18% |
- Attractive rent-to-price ratio for income stability
- Good fit for DSCR financing with healthy coverage
Manufactured
Built in 1973
3,770 sqft lot
$N/A/sqft
No HOA
Neighborhood Data
Neighborhood data shown for ZIP Code: 93015, Fillmore, CA area.
Housing Distribution
Housing Statistics
| Category | Value |
|---|---|
| Total HU (Housing Units) | 5,986 (100%) |
| Owner Occupied HU | 3,857 (64.4%) |
| Renter Occupied HU | 1,848 (30.9%) |
| Vacant Housing Units | 281 ( 4.7%) |
| Median Home Value | $652,909 |
| Average Home Value | $708,417 |
Housing Distribution
Address Breakdown
Residential
5,904
Single Family
5,548
Multi-Family
356
Businesses
275
Nearby investment properties with comparable rents
Nearby investment properties with comparable prices