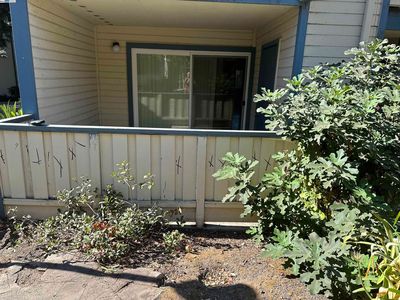
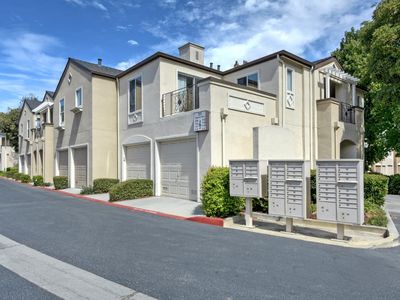
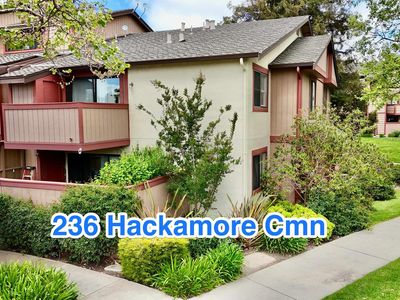
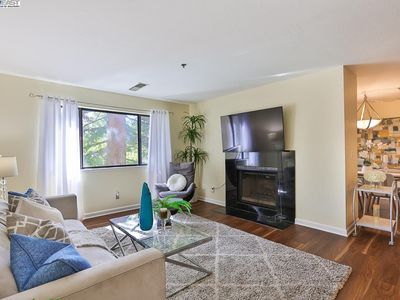
2303 Lava DrSan JoseCA95133
INVESTMENT ANALYSIS
Investment Verdict
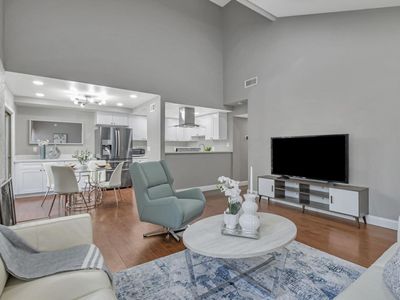
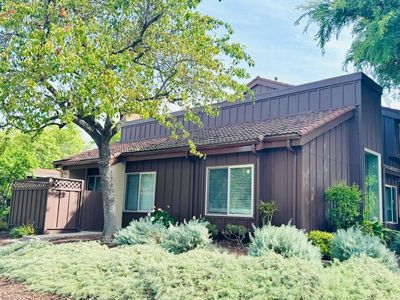
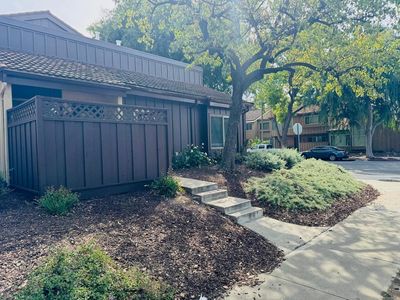
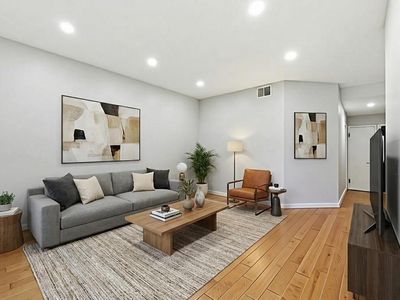
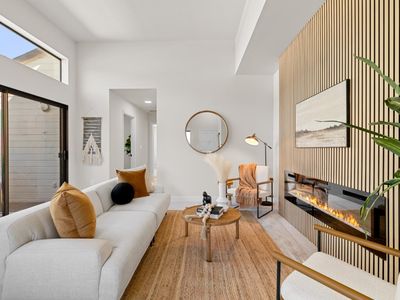
Appreciation PlayNot all U.S. investment properties are valued for current income. 2303 Lava Dr, San Jose, CA, 95133 in San Jose at $786,000, 5.81% gross yield, is a market-growth asset. Rental yield 5.81%. The $3,808/mo rent partially funds the $3,534/mo debt service; the core return is the 5%/yr price growth projected to add $217,157 over five years. Ziffy Mortgage's DSCR mortgage (1.08) provides financing for foreign nationals without domestic income checks. A 30–35% down payment often produces the cleanest coverage for low-yield properties. Total five-year return: $176,322.
| This Property | City Avg | |
|---|---|---|
| Gross Rental Yield | 5.8% | 6.0% |
| Monthly Cash Flow | $(1,953) | $500 |
City averages based on San Jose market data in our database. Property projections are estimates.
DSCR Loan Qualification
| Monthly Rental Income | $3,808 |
| Total Monthly Debt Service | $5,448 |
| DSCR Ratio | 0.70x |
Ziffy Mortgage typically prefers a DSCR of 1.0+, but in some cases you may qualify with a DSCR below 1. To explore if this deal qualifies for an investment mortgage, book time with your loan officer →
Estimates assume 6.0% rate / 30-yr fixed, 30% down, 1% tax, 0.5% insurance. Not a commitment to lend.
Townhouse
Built in 1974
1,818 sqft lot
$N/A/sqft
$535 monthly HOA
Neighborhood Data
Neighborhood data shown for ZIP Code: 95133, San Jose, CA area.
Housing Distribution
Housing Statistics
| Category | Value |
|---|---|
| Total HU (Housing Units) | 9,500 (100%) |
| Owner Occupied HU | 5,088 (53.6%) |
| Renter Occupied HU | 4,154 (43.7%) |
| Vacant Housing Units | 258 ( 2.7%) |
| Median Home Value | $1,183,293 |
| Average Home Value | $1,191,329 |
Housing Distribution
Address Breakdown
Residential
9,657
Single Family
8,248
Multi-Family
1,409
Businesses
472


Nearby investment properties with comparable rents
Nearby investment properties with comparable prices


Ziffy AI Summary
A quick, investor-focused snapshot highlighting income strength, yield potential.
| Key metrics | Value |
|---|---|
| Price | $399,900 |
| Est. Rent | $3,200/mo |
| ROI | 18% |
- Attractive rent-to-price ratio for income stability
- Good fit for DSCR financing with healthy coverage
Townhouse
Built in 1974
1,818 sqft lot
$N/A/sqft
$535 monthly HOA
Neighborhood Data
Neighborhood data shown for ZIP Code: 95133, San Jose, CA area.
Housing Distribution
Housing Statistics
| Category | Value |
|---|---|
| Total HU (Housing Units) | 9,500 (100%) |
| Owner Occupied HU | 5,088 (53.6%) |
| Renter Occupied HU | 4,154 (43.7%) |
| Vacant Housing Units | 258 ( 2.7%) |
| Median Home Value | $1,183,293 |
| Average Home Value | $1,191,329 |
Housing Distribution
Address Breakdown
Residential
9,657
Single Family
8,248
Multi-Family
1,409
Businesses
472
Nearby investment properties with comparable rents
Nearby investment properties with comparable prices
Listed by: Chintan Shah • Alliance Bay Realty
Mls Name: MLSListings Inc
Mls Provider:
Mls ID: #ML82004826
Disclaimer: Based on information from the MLSListings MLS as of 2025-04-30 18:23:55 PDT. All data, including all measurements and calculations of area, is obtained from various sources and has not been, and will not be, verified by broker or MLS. All information should be independently reviewed and verified for accuracy. Properties may or may not be listed by the office/agent presenting the information.