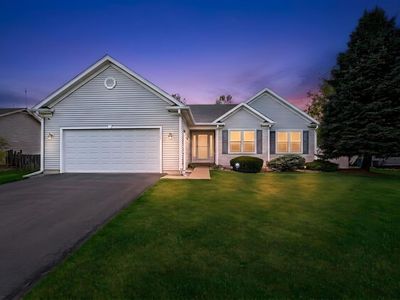
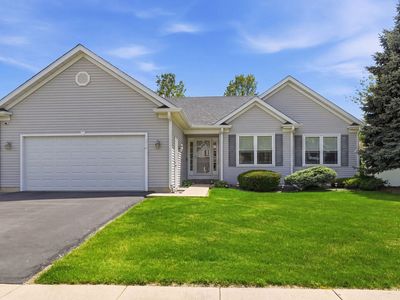
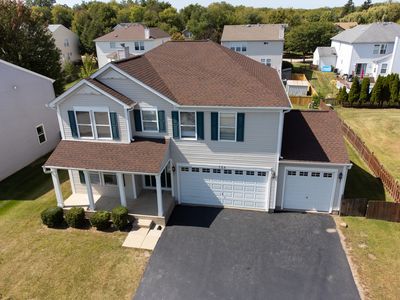
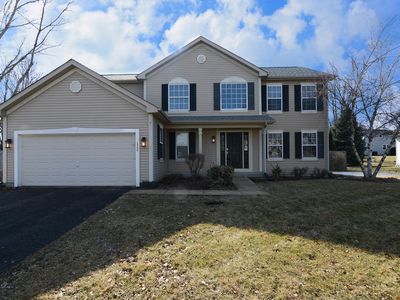
230 Wendy StSycamoreIL60178
INVESTMENT ANALYSIS
Investment Verdict
Appreciation PlayMarkets with strong demand fundamentals often produce low-yield, high-appreciation assets. 230 Wendy St, Sycamore, IL, 60178 in Sycamore fits: $439,999, 2.45% gross yield, and a projected 5% annual appreciation rate adding $121,564 in value within five years. Rental yield 2.45%. The narrow rent-to-debt spread is the trade-off for market growth. Ziffy Mortgage's DSCR loan (0.45) finances non-U.S. buyers without personal income documentation; optimise coverage with a 30–35% down payment. $4,052/yr in principal paydown and $121,564 in appreciation project a total return of $29,776.
| This Property | City Avg | |
|---|---|---|
| Gross Rental Yield | 2.5% | 6.0% |
| Monthly Cash Flow | $(2,152) | $1,500 |
City averages based on Sycamore market data in our database. Property projections are estimates.
DSCR Rental Loan Qualification
Qualifies using the property's rental income, not your personal income.
- ✓No W-2, pay stubs, or tax returns needed
- ✓Rental income qualifies you
- ✓Built for real estate investors
| Monthly Rental Income | $900 |
| Total Monthly Debt Service | $2,877 |
| DSCR Ratio | 0.31x |
Ziffy Mortgage typically prefers a DSCR of 1.0+, but in some cases you may qualify with a DSCR below 1. To explore if this deal qualifies for an investment mortgage, book time with your loan officer →
Estimates assume 6.0% rate / 30-yr fixed, 30% down, 1% tax, 0.5% insurance. Not a commitment to lend.
Single Family
Built in 1999
10,454 sqft lot
$N/A/sqft
No HOA
Neighborhood Data
Neighborhood data shown for ZIP Code: 60178, Sycamore, IL area.
Housing Distribution
Housing Statistics
| Category | Value |
|---|---|
| Total HU (Housing Units) | 9,574 (100%) |
| Owner Occupied HU | 6,596 (68.9%) |
| Renter Occupied HU | 2,621 (27.4%) |
| Vacant Housing Units | 357 ( 3.7%) |
| Median Home Value | $282,093 |
| Average Home Value | $299,103 |
Housing Distribution
Address Breakdown
Residential
9,395
Single Family
8,862
Multi-Family
533
Businesses
816


Nearby investment properties with comparable rents
Nearby investment properties with comparable prices


Ziffy AI Summary
A quick, investor-focused snapshot highlighting income strength, yield potential.
| Key metrics | Value |
|---|---|
| Price | $399,900 |
| Est. Rent | $3,200/mo |
| ROI | 18% |
- Attractive rent-to-price ratio for income stability
- Good fit for DSCR financing with healthy coverage
Single Family
Built in 1999
10,454 sqft lot
$N/A/sqft
No HOA
Neighborhood Data
Neighborhood data shown for ZIP Code: 60178, Sycamore, IL area.
Housing Distribution
Housing Statistics
| Category | Value |
|---|---|
| Total HU (Housing Units) | 9,574 (100%) |
| Owner Occupied HU | 6,596 (68.9%) |
| Renter Occupied HU | 2,621 (27.4%) |
| Vacant Housing Units | 357 ( 3.7%) |
| Median Home Value | $282,093 |
| Average Home Value | $299,103 |
Housing Distribution
Address Breakdown
Residential
9,395
Single Family
8,862
Multi-Family
533
Businesses
816
Nearby investment properties with comparable rents
Nearby investment properties with comparable prices
Listed by: Judah Sameth • Willow Real Estate, Inc
Mls Name: MRED as distributed by MLS GRID
Mls Provider:
Mls ID: #12645266
Disclaimer: Based on information submitted to the MLS GRID as of 2026. All data is obtained from various sources and may not have been verified by broker or MLS GRID. Supplied Open House Information is subject to change without notice. All information should be independently reviewed and verified for accuracy. Properties may or may not be listed by the office/agent presenting the information. [Click here for more information](/mls-disclaimers/#17)