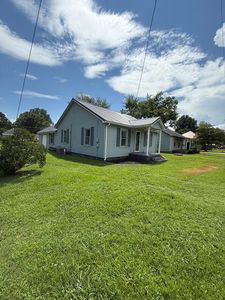
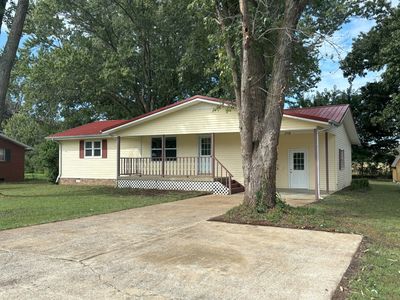
225 E Chestnut StPuryearTN38251
INVESTMENT ANALYSIS
Investment Verdict
Appreciation Play225 E Chestnut St, Puryear, TN, 38251 in Puryear is priced for appreciation, not yield. Rental yield 0%. At $132,000 with a 0% gross yield, the monthly income is modest, but 5% annual price growth is projected to add $36,469 in value over five years, making equity the primary return driver. Ziffy Mortgage's DSCR mortgage (0.00) can still finance this property for non-U.S. residents; a 30–35% down payment typically produces the cleanest underwriting for appreciation-focused assets.
| This Property | National Avg | |
|---|---|---|
| Gross Rental Yield | 0% | 6.2% |
| Monthly Cash Flow | $0 | $180 |
National averages based on 2024–2025 U.S. residential rental market data. Content is user-generated and unverified.
Single Family
Built in 1950
7,000 sqft lot
$N/A/sqft
No HOA
Neighborhood Data
Neighborhood data shown for ZIP Code: 38251, Puryear, TN area.
Housing Distribution
Housing Statistics
| Category | Value |
|---|---|
| Total HU (Housing Units) | 1,327 (100%) |
| Owner Occupied HU | 946 (71.3%) |
| Renter Occupied HU | 221 (16.7%) |
| Vacant Housing Units | 160 (12.1%) |
| Median Home Value | $158,108 |
| Average Home Value | $241,863 |
Housing Distribution
Address Breakdown
Residential
1,179
Single Family
1,179
Multi-Family
0
Businesses
53


Nearby investment properties with comparable rents
No similar rental properties found nearby.
Nearby investment properties with comparable prices

Ziffy AI Summary
A quick, investor-focused snapshot highlighting income strength, yield potential.
| Key metrics | Value |
|---|---|
| Price | $399,900 |
| Est. Rent | $3,200/mo |
| ROI | 18% |
- Attractive rent-to-price ratio for income stability
- Good fit for DSCR financing with healthy coverage
Single Family
Built in 1950
7,000 sqft lot
$N/A/sqft
No HOA
Neighborhood Data
Neighborhood data shown for ZIP Code: 38251, Puryear, TN area.
Housing Distribution
Housing Statistics
| Category | Value |
|---|---|
| Total HU (Housing Units) | 1,327 (100%) |
| Owner Occupied HU | 946 (71.3%) |
| Renter Occupied HU | 221 (16.7%) |
| Vacant Housing Units | 160 (12.1%) |
| Median Home Value | $158,108 |
| Average Home Value | $241,863 |
Housing Distribution
Address Breakdown
Residential
1,179
Single Family
1,179
Multi-Family
0
Businesses
53
Nearby investment properties with comparable rents
No similar rental properties found nearby.
Nearby investment properties with comparable prices
Listed by: Carrye Jackson • Moody Realty Company, Inc.
Mls Name: Tennessee Valley MLS
Mls Provider:
Mls ID: #134427
Disclaimer: Copyright Tennessee Valley Association of REALTORS. All rights reserved. Some or all of the listings displayed may not belong to the firm whose website is being visited. Information is deemed reliable but not guaranteed.