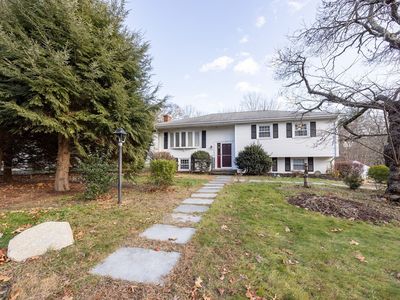
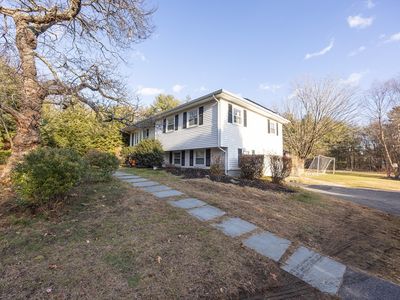
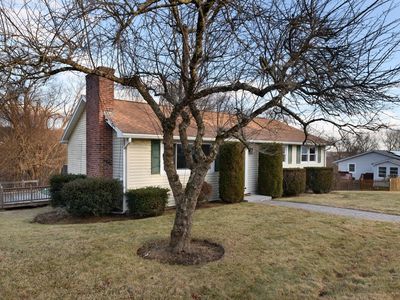
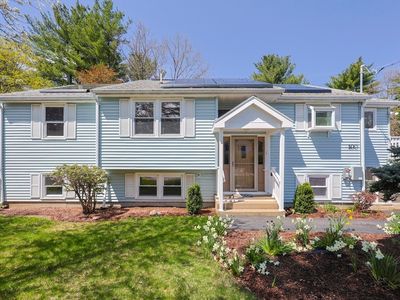
222 Blackstone StBellinghamMA02019
INVESTMENT ANALYSIS
Investment Verdict
Steady Equity BuilderThis is a cash-flow-light asset: 222 Blackstone St, Bellingham, MA, 02019 in Bellingham, $585,000, 7.63% gross yield, $30/mo net income. Consider it a market-entry position, the $3,718/mo rent covers the $2,631/mo payment with a margin, and 5%/yr appreciation is projected to add $161,625 to the asset's value over five years. Ziffy Mortgage approves DSCR loans (coverage 1.41) for non-U.S. residents without domestic income documentation. Consider a higher down payment to widen the monthly margin. Total projected return: $224,103.
| This Property | City Avg | |
|---|---|---|
| Gross Rental Yield | 7.6% | 5.8% |
| Monthly Cash Flow | $30 | $850 |
City averages based on Bellingham market data in our database. Property projections are estimates.
DSCR Rental Loan Qualification
Qualifies using the property's rental income, not your personal income.
- ✓No W-2, pay stubs, or tax returns needed
- ✓Rental income qualifies you
- ✓Built for real estate investors
| Monthly Rental Income | $3,718 |
| Total Monthly Debt Service | $3,454 |
| DSCR Ratio | 1.08x |
Ziffy Mortgage: Your DSCR most likely meets our 1.0+ requirement, so you'll most probably qualify for our standard DSCR investment loan program. To pre-qualify, book time with your loan officer →
Estimates assume 6.0% rate / 30-yr fixed, 30% down, 1% tax, 0.5% insurance. Not a commitment to lend.
Single Family
Built in 1966
0.85 Acres lot
$N/A/sqft
No HOA
Neighborhood Data
Neighborhood data shown for ZIP Code: 02019, Bellingham, MA area.
Housing Distribution
Housing Statistics
| Category | Value |
|---|---|
| Total HU (Housing Units) | 7,025 (100%) |
| Owner Occupied HU | 5,643 (80.3%) |
| Renter Occupied HU | 1,183 (16.8%) |
| Vacant Housing Units | 199 ( 2.8%) |
| Median Home Value | $551,091 |
| Average Home Value | $735,060 |
Housing Distribution
Address Breakdown
Residential
6,922
Single Family
6,450
Multi-Family
472
Businesses
541


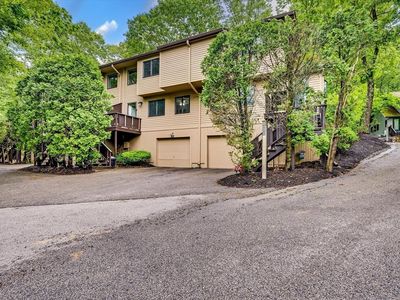
Nearby investment properties with comparable rents
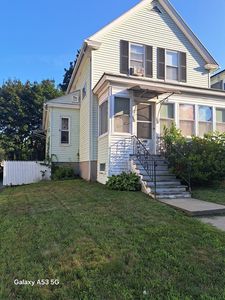
Nearby investment properties with comparable prices

Ziffy AI Summary
A quick, investor-focused snapshot highlighting income strength, yield potential.
| Key metrics | Value |
|---|---|
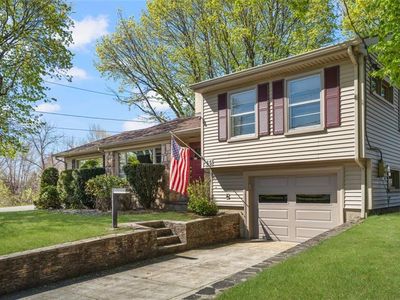
| Price | $399,900 |
| Est. Rent | $3,200/mo |
| ROI | 18% |
- Attractive rent-to-price ratio for income stability
- Good fit for DSCR financing with healthy coverage
Single Family
Built in 1966
0.85 Acres lot
$N/A/sqft
No HOA
Neighborhood Data
Neighborhood data shown for ZIP Code: 02019, Bellingham, MA area.
Housing Distribution
Housing Statistics
| Category | Value |
|---|---|
| Total HU (Housing Units) | 7,025 (100%) |
| Owner Occupied HU | 5,643 (80.3%) |
| Renter Occupied HU | 1,183 (16.8%) |
| Vacant Housing Units | 199 ( 2.8%) |
| Median Home Value | $551,091 |
| Average Home Value | $735,060 |
Housing Distribution
Address Breakdown
Residential
6,922
Single Family
6,450
Multi-Family
472
Businesses
541
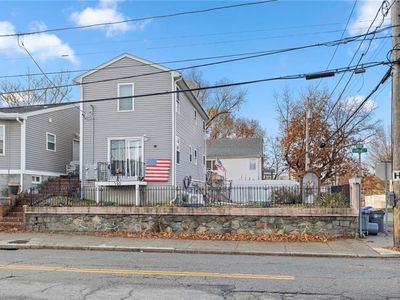
Nearby investment properties with comparable rents
Nearby investment properties with comparable prices
Listed by: Marcia Pessanha • eXp Realty
Mls Name: MLS PIN
Mls ID: #73461416