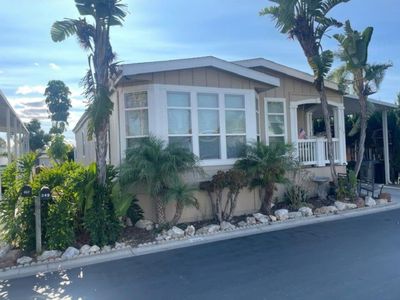
2151 Oakland Rd SPC 249San JoseCA95131
INVESTMENT ANALYSIS
Investment Verdict
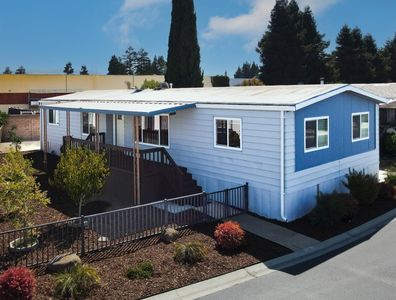
Strong Cash FlowStrong cash flow defines 2151 Oakland Rd SPC 249, San Jose, CA, 95131 in San Jose: $6,427/mo in rent, $4,268/mo net, 22.1% gross yield, all on a $349,000 acquisition. The 4.10 coverage ratio comfortably clears Ziffy Mortgage's threshold, enabling foreign-national buyers to close without U.S. credit documentation. Over five years, 5% appreciation adds $96,422 in value, and $3,214/yr in principal paydown steadily builds equity. Projected total cumulative return: $407,042.
| This Property | City Avg | |
|---|---|---|
| Gross Rental Yield | 22.1% | 6.0% |
| Monthly Cash Flow | $4,268 | $500 |
City averages based on San Jose market data in our database. Property projections are estimates.
DSCR Rental Loan Qualification
Qualifies using the property's rental income, not your personal income.
- ✓No W-2, pay stubs, or tax returns needed
- ✓Rental income qualifies you
- ✓Built for real estate investors
| Monthly Rental Income | $6,427 |
| Total Monthly Debt Service | $2,020 |
| DSCR Ratio | 3.18x |
Ziffy Mortgage: Your DSCR most likely meets our 1.0+ requirement, so you'll most probably qualify for our standard DSCR investment loan program. To pre-qualify, book time with your loan officer →
Estimates assume 6.0% rate / 30-yr fixed, 30% down, 1% tax, 0.5% insurance. Not a commitment to lend.
Manufactured
Built in 2014
N/A lot
$N/A/sqft
No HOA
Neighborhood Data
Neighborhood data shown for ZIP Code: 95131, San Jose, CA area.
Housing Distribution
Housing Statistics
| Category | Value |
|---|---|
| Total HU (Housing Units) | 11,194 (100%) |
| Owner Occupied HU | 5,846 (52.2%) |
| Renter Occupied HU | 4,586 (41.0%) |
| Vacant Housing Units | 762 ( 6.8%) |
| Median Home Value | $1,261,536 |
| Average Home Value | $1,231,983 |
Housing Distribution
Address Breakdown
Residential
9,913
Single Family
9,412
Multi-Family
501
Businesses
2,034


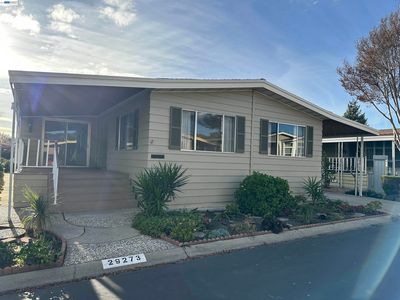
Nearby investment properties with comparable rents
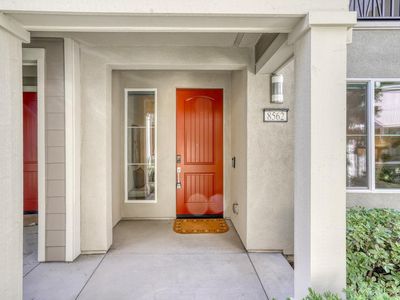
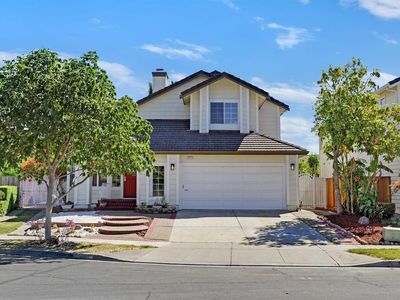
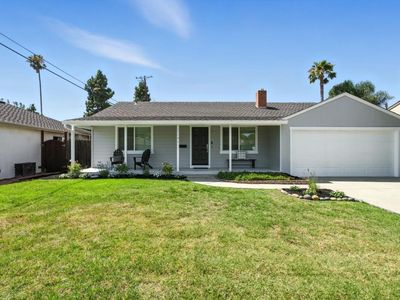
Nearby investment properties with comparable prices

Ziffy AI Summary
A quick, investor-focused snapshot highlighting income strength, yield potential.
| Key metrics | Value |
|---|---|
| Price | $399,900 |
| Est. Rent | $3,200/mo |
| ROI | 18% |
- Attractive rent-to-price ratio for income stability
- Good fit for DSCR financing with healthy coverage
Manufactured
Built in 2014
N/A lot
$N/A/sqft
No HOA
Neighborhood Data
Neighborhood data shown for ZIP Code: 95131, San Jose, CA area.
Housing Distribution
Housing Statistics
| Category | Value |
|---|---|
| Total HU (Housing Units) | 11,194 (100%) |
| Owner Occupied HU | 5,846 (52.2%) |
| Renter Occupied HU | 4,586 (41.0%) |
| Vacant Housing Units | 762 ( 6.8%) |
| Median Home Value | $1,261,536 |
| Average Home Value | $1,231,983 |
Housing Distribution
Address Breakdown
Residential
9,913
Single Family
9,412
Multi-Family
501
Businesses
2,034
Nearby investment properties with comparable rents
Nearby investment properties with comparable prices