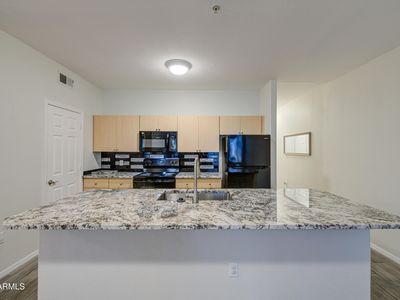
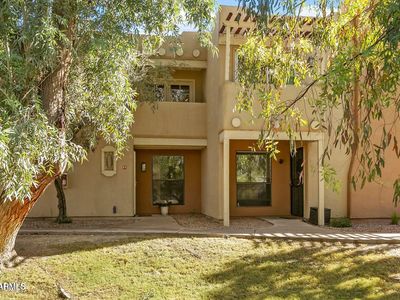
2146 W Harmont DrPhoenixAZ85021
INVESTMENT ANALYSIS
Investment Verdict
Appreciation PlayMarkets with strong demand fundamentals often produce low-yield, high-appreciation assets. 2146 W Harmont Dr, Phoenix, AZ, 85021 in Phoenix fits: $366,950, 5.77% gross yield, and a projected 5% annual appreciation rate adding $101,382 in value within five years. Rental yield 5.77%. The narrow rent-to-debt spread is the trade-off for market growth. Ziffy Mortgage's DSCR loan (1.07) finances non-U.S. buyers without personal income documentation; optimise coverage with a 30–35% down payment. $3,380/yr in principal paydown and $101,382 in appreciation project a total return of $102,797.
| This Property | City Avg | |
|---|---|---|
| Gross Rental Yield | 5.8% | 6.2% |
| Monthly Cash Flow | $(569) | $450 |
City averages based on Phoenix market data in our database. Property projections are estimates.
DSCR Rental Loan Qualification
Qualifies using the property's rental income, not your personal income.
- ✓No W-2, pay stubs, or tax returns needed
- ✓Rental income qualifies you
- ✓Built for real estate investors
| Monthly Rental Income | $1,764 |
| Total Monthly Debt Service | $2,187 |
| DSCR Ratio | 0.81x |
Ziffy Mortgage typically prefers a DSCR of 1.0+, but in some cases you may qualify with a DSCR below 1. To explore if this deal qualifies for an investment mortgage, book time with your loan officer →
Estimates assume 6.0% rate / 30-yr fixed, 30% down, 1% tax, 0.5% insurance. Not a commitment to lend.
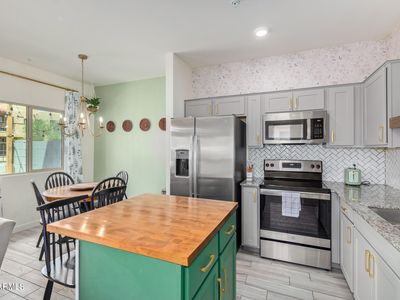
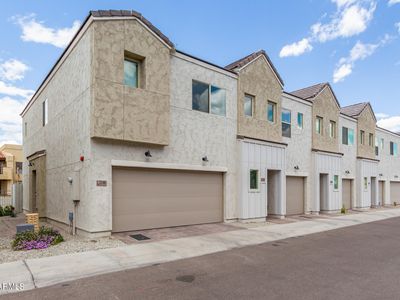
Townhouse
Built in 2021
1,239 sqft lot
$N/A/sqft
$164 monthly HOA
Neighborhood Data
Neighborhood data shown for ZIP Code: 85021, Phoenix, AZ area.
Housing Distribution
Housing Statistics
| Category | Value |
|---|---|
| Total HU (Housing Units) | 18,096 (100%) |
| Owner Occupied HU | 7,339 (40.6%) |
| Renter Occupied HU | 9,422 (52.1%) |
| Vacant Housing Units | 1,335 ( 7.4%) |
| Median Home Value | $504,448 |
| Average Home Value | $571,329 |
Housing Distribution
Address Breakdown
Residential
17,469
Single Family
8,573
Multi-Family
8,896
Businesses
1,150


Nearby investment properties with comparable rents
Nearby investment properties with comparable prices

Ziffy AI Summary
A quick, investor-focused snapshot highlighting income strength, yield potential.
| Key metrics | Value |
|---|---|
| Price | $399,900 |
| Est. Rent | $3,200/mo |
| ROI | 18% |
- Attractive rent-to-price ratio for income stability
- Good fit for DSCR financing with healthy coverage
Townhouse
Built in 2021
1,239 sqft lot
$N/A/sqft
$164 monthly HOA
Neighborhood Data
Neighborhood data shown for ZIP Code: 85021, Phoenix, AZ area.
Housing Distribution
Housing Statistics
| Category | Value |
|---|---|
| Total HU (Housing Units) | 18,096 (100%) |
| Owner Occupied HU | 7,339 (40.6%) |
| Renter Occupied HU | 9,422 (52.1%) |
| Vacant Housing Units | 1,335 ( 7.4%) |
| Median Home Value | $504,448 |
| Average Home Value | $571,329 |
Housing Distribution
Address Breakdown
Residential
17,469
Single Family
8,573
Multi-Family
8,896
Businesses
1,150
Nearby investment properties with comparable rents
Nearby investment properties with comparable prices
Listed by: Cheryl Park • eXp Realty
Mls Name: ARMLS
Mls Provider:
Mls ID: #6698764
Disclaimer: All information should be verified by the recipient and none is guaranteed as accurate by ARMLS Listing Information presented by local MLS brokerage: Zillow, Inc., Designated REALTOR- Chris Long - (480) 907-1010