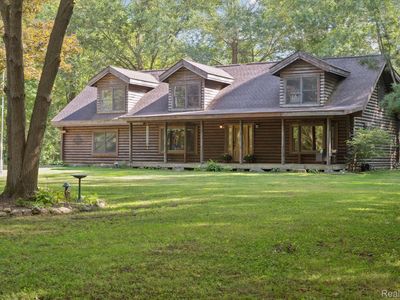
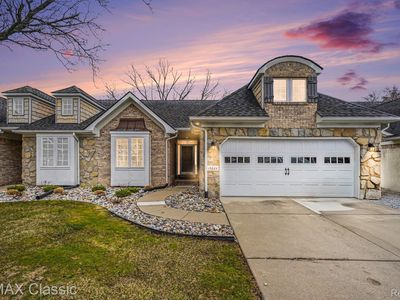
21435 Merriman RdNew BostonMI48164
INVESTMENT ANALYSIS
Investment Verdict
Steady Equity BuilderReliable and efficiently structured, 21435 Merriman Rd, New Boston, MI, 48164 in New Boston is a conservative rental investment at $439,900. Rental yield 7.81%. A 1.45 coverage ratio meets Ziffy Mortgage's DSCR standard for foreign-national financing. Five-year equity: 5% appreciation adds $121,536; $4,052/yr in principal paydown supplements. Total projected return: $165,248.
| This Property | City Avg | |
|---|---|---|
| Gross Rental Yield | 7.8% | 6.5% |
| Monthly Cash Flow | $(37) | $650 |
City averages based on New Boston market data in our database. Property projections are estimates.
DSCR Rental Loan Qualification
Qualifies using the property's rental income, not your personal income.
- ✓No W-2, pay stubs, or tax returns needed
- ✓Rental income qualifies you
- ✓Built for real estate investors
| Monthly Rental Income | $2,864 |
| Total Monthly Debt Service | $2,726 |
| DSCR Ratio | 1.05x |
Ziffy Mortgage: Your DSCR most likely meets our 1.0+ requirement, so you'll most probably qualify for our standard DSCR investment loan program. To pre-qualify, book time with your loan officer →
Estimates assume 6.0% rate / 30-yr fixed, 30% down, 1% tax, 0.5% insurance. Not a commitment to lend.
Single Family
Built in 1994
1.51 Acres lot
$N/A/sqft
No HOA
Neighborhood Data
Neighborhood data shown for ZIP Code: 48164, New Boston, MI area.
Housing Distribution
Housing Statistics
| Category | Value |
|---|---|
| Total HU (Housing Units) | 3,650 (100%) |
| Owner Occupied HU | 3,244 (88.9%) |
| Renter Occupied HU | 275 ( 7.5%) |
| Vacant Housing Units | 131 ( 3.6%) |
| Median Home Value | $331,699 |
| Average Home Value | $334,306 |
Housing Distribution
Address Breakdown
Residential
3,822
Single Family
3,822
Multi-Family
0
Businesses
197


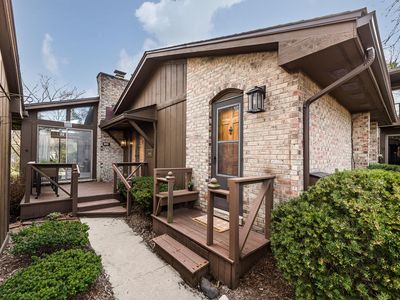
Nearby investment properties with comparable rents

Nearby investment properties with comparable prices

Ziffy AI Summary
A quick, investor-focused snapshot highlighting income strength, yield potential.
| Key metrics | Value |
|---|---|
| Price | $399,900 |
| Est. Rent | $3,200/mo |
| ROI | 18% |
- Attractive rent-to-price ratio for income stability
- Good fit for DSCR financing with healthy coverage
Single Family
Built in 1994
1.51 Acres lot
$N/A/sqft
No HOA
Neighborhood Data
Neighborhood data shown for ZIP Code: 48164, New Boston, MI area.
Housing Distribution
Housing Statistics
| Category | Value |
|---|---|
| Total HU (Housing Units) | 3,650 (100%) |
| Owner Occupied HU | 3,244 (88.9%) |
| Renter Occupied HU | 275 ( 7.5%) |
| Vacant Housing Units | 131 ( 3.6%) |
| Median Home Value | $331,699 |
| Average Home Value | $334,306 |
Housing Distribution
Address Breakdown
Residential
3,822
Single Family
3,822
Multi-Family
0
Businesses
197
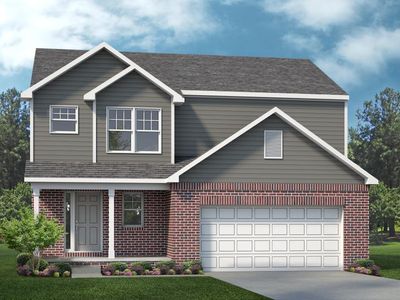
Nearby investment properties with comparable rents
Nearby investment properties with comparable prices
Listed by: David Ciha • EXP Realty Main
Mls Name: Realcomp II
Mls ID: #20251032205