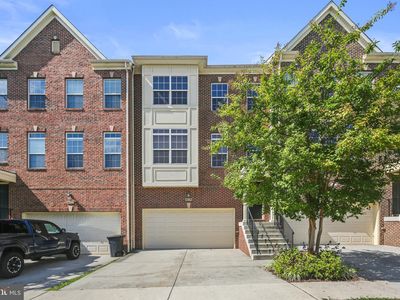
2116 N Capitol StWashingtonDC20002
INVESTMENT ANALYSIS
Investment Verdict
Appreciation PlayYield and appreciation often trade off, and at 2116 N Capitol St, Washington, DC, 20002 in Washington the bet is firmly on appreciation. Rental yield 0%. The 0% gross yield on a $1,052,900 price is below income-first thresholds, but 5%/yr value growth projects $290,897 in equity by year five. Ziffy Mortgage's non-U.S. DSCR mortgage (0.00) finances the acquisition on rental income alone. A larger down payment (30–35%) reduces monthly debt service and tightens the spread. Total projected cumulative return: $1,105.
| This Property | City Avg | |
|---|---|---|
| Gross Rental Yield | 0% | 5.2% |
| Monthly Cash Flow | $0 | $1,200 |
City averages based on Washington market data in our database. Property projections are estimates.
Home Type Unknown
Built in N/A
N/A lot
$N/A/sqft
No HOA
Neighborhood Data
Neighborhood data shown for ZIP Code: 20002, Washington, DC area.
Housing Distribution
Housing Statistics
| Category | Value |
|---|---|
| Total HU (Housing Units) | 45,543 (100%) |
| Owner Occupied HU | 12,288 (27.0%) |
| Renter Occupied HU | 26,295 (57.7%) |
| Vacant Housing Units | 6,960 (15.3%) |
| Median Home Value | $826,456 |
| Average Home Value | $892,956 |
Housing Distribution
Address Breakdown
Residential
43,009
Single Family
18,248
Multi-Family
24,761
Businesses
1,755


Nearby investment properties with comparable rents
No similar rental properties found nearby.
Nearby investment properties with comparable prices


Ziffy AI Summary
A quick, investor-focused snapshot highlighting income strength, yield potential.
| Key metrics | Value |
|---|---|
| Price | $399,900 |
| Est. Rent | $3,200/mo |
| ROI | 18% |
- Attractive rent-to-price ratio for income stability
- Good fit for DSCR financing with healthy coverage
Home Type Unknown
Built in N/A
N/A lot
$N/A/sqft
No HOA
Neighborhood Data
Neighborhood data shown for ZIP Code: 20002, Washington, DC area.
Housing Distribution
Housing Statistics
| Category | Value |
|---|---|
| Total HU (Housing Units) | 45,543 (100%) |
| Owner Occupied HU | 12,288 (27.0%) |
| Renter Occupied HU | 26,295 (57.7%) |
| Vacant Housing Units | 6,960 (15.3%) |
| Median Home Value | $826,456 |
| Average Home Value | $892,956 |
Housing Distribution
Address Breakdown
Residential
43,009
Single Family
18,248
Multi-Family
24,761
Businesses
1,755
Nearby investment properties with comparable rents
No similar rental properties found nearby.
Nearby investment properties with comparable prices
Listed by: N/A • N/A
Mls Name: undefined
Mls ID: #N/A