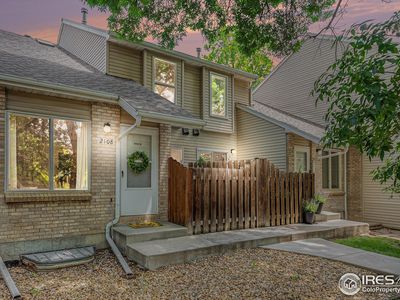
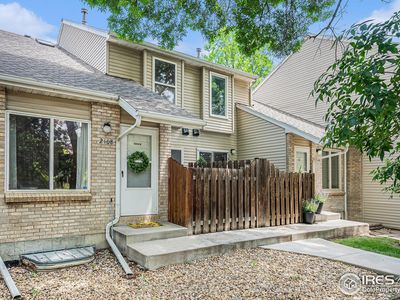
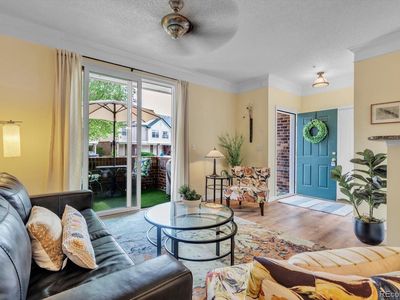
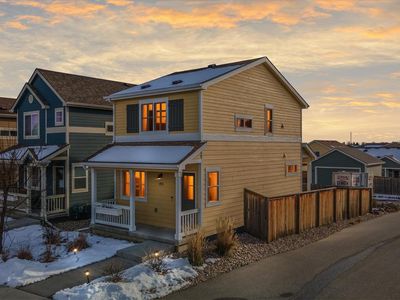
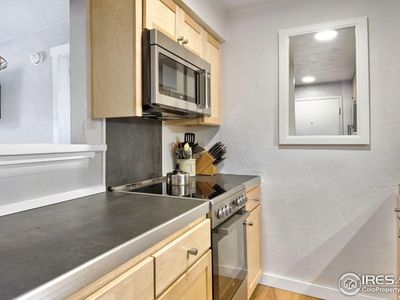
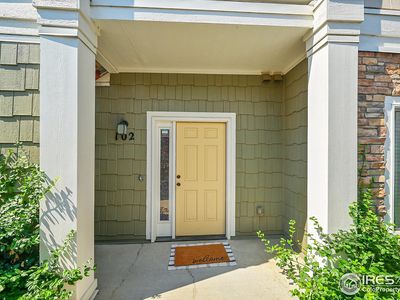
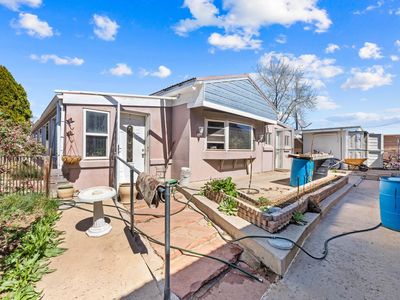
2108 Meadow CtLongmontCO80501
INVESTMENT ANALYSIS
Investment Verdict
Solid IncomeThis is a cash-flow-light asset: 2108 Meadow Ct, Longmont, CO, 80501 in Longmont, $355,000, 8.25% gross yield, $84/mo net income. Consider it a market-entry position, the $2,440/mo rent covers the $1,596/mo payment with a margin, and 5%/yr appreciation is projected to add $98,080 to the asset's value over five years. Ziffy Mortgage approves DSCR loans (coverage 1.53) for non-U.S. residents without domestic income documentation. Consider a higher down payment to widen the monthly margin. Total projected return: $140,741.
| This Property | City Avg | |
|---|---|---|
| Gross Rental Yield | 8.3% | 5.5% |
| Monthly Cash Flow | $84 | $250 |
City averages based on Longmont market data in our database. Property projections are estimates.
DSCR Rental Loan Qualification
Qualifies using the property's rental income, not your personal income.
- ✓No W-2, pay stubs, or tax returns needed
- ✓Rental income qualifies you
- ✓Built for real estate investors
| Monthly Rental Income | $2,440 |
| Total Monthly Debt Service | $2,215 |
| DSCR Ratio | 1.10x |
Ziffy Mortgage: Your DSCR most likely meets our 1.0+ requirement, so you'll most probably qualify for our standard DSCR investment loan program. To pre-qualify, book time with your loan officer →
Estimates assume 6.0% rate / 30-yr fixed, 30% down, 1% tax, 0.5% insurance. Not a commitment to lend.
Townhouse
Built in 1993
1,081 sqft lot
$N/A/sqft
$287 monthly HOA
Neighborhood Data
Neighborhood data shown for ZIP Code: 80501, Longmont, CO area.
Housing Distribution
Housing Statistics
| Category | Value |
|---|---|
| Total HU (Housing Units) | 19,152 (100%) |
| Owner Occupied HU | 9,296 (48.5%) |
| Renter Occupied HU | 8,725 (45.6%) |
| Vacant Housing Units | 1,131 ( 5.9%) |
| Median Home Value | $545,081 |
| Average Home Value | $664,784 |
Housing Distribution
Address Breakdown
Residential
19,261
Single Family
15,147
Multi-Family
4,114
Businesses
2,260


Nearby investment properties with comparable rents
Nearby investment properties with comparable prices


Ziffy AI Summary
A quick, investor-focused snapshot highlighting income strength, yield potential.
| Key metrics | Value |
|---|---|
| Price | $399,900 |
| Est. Rent | $3,200/mo |
| ROI | 18% |
- Attractive rent-to-price ratio for income stability
- Good fit for DSCR financing with healthy coverage
Townhouse
Built in 1993
1,081 sqft lot
$N/A/sqft
$287 monthly HOA
Neighborhood Data
Neighborhood data shown for ZIP Code: 80501, Longmont, CO area.
Housing Distribution
Housing Statistics
| Category | Value |
|---|---|
| Total HU (Housing Units) | 19,152 (100%) |
| Owner Occupied HU | 9,296 (48.5%) |
| Renter Occupied HU | 8,725 (45.6%) |
| Vacant Housing Units | 1,131 ( 5.9%) |
| Median Home Value | $545,081 |
| Average Home Value | $664,784 |
Housing Distribution
Address Breakdown
Residential
19,261
Single Family
15,147
Multi-Family
4,114
Businesses
2,260
Nearby investment properties with comparable rents
Nearby investment properties with comparable prices
Listed by: Josh Roberson • Ideal Team Homes
Mls Name: IRES
Mls Provider:
Mls ID: #1035973
Disclaimer: Information source: Information and Real Estate Services, LLC. Provided for limited non-commercial use only under IRES Rules Copyright IRES. Listing information is provided exclusively for consumers' personal, non-commercial use and may not be used for any purpose other than to identify prospective properties consumers may be interested in purchasing. Information deemed reliable but not guaranteed by the MLS.