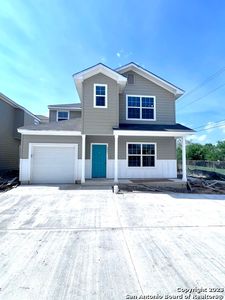
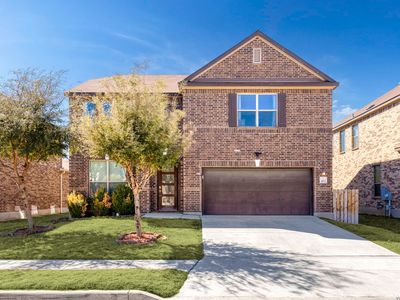
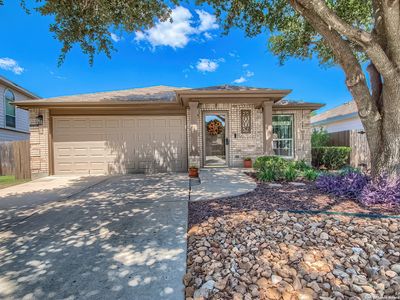
2081 Silver Oak DrSan AntonioTX78213
INVESTMENT ANALYSIS
Investment Verdict
Strong Cash FlowDay-one income is the story at 2081 Silver Oak Dr, San Antonio, TX, 78213 in San Antonio. Priced at $309,000, it generates $3,617/mo in gross rent and $1,394/mo in net monthly cash flow, a 14.05% yield that comfortably supports the 2.60 DSCR needed for Ziffy Mortgage's no-W2 DSCR mortgage. Projected annual cash flow: $16,733. Five-year appreciation: $85,371. Equity from principal paydown: $2,846/yr. Total projected cumulative return: $208,352.
| This Property | City Avg | |
|---|---|---|
| Gross Rental Yield | 14.1% | 5.8% |
| Monthly Cash Flow | $1,394 | $450 |
City averages based on San Antonio market data in our database. Property projections are estimates.
DSCR Loan Qualification
| Monthly Rental Income | $3,617 |
| Total Monthly Debt Service | $2,099 |
| DSCR Ratio | 1.72x |
Ziffy Mortgage: Your DSCR most likely meets our 1.0+ requirement, so you'll most probably qualify for our standard DSCR investment loan program. To pre-qualify, book time with your loan officer →
Estimates assume 6.0% rate / 30-yr fixed, 30% down, 1% tax, 0.5% insurance. Not a commitment to lend.
Townhouse
Built in 2023
6,534 sqft lot
$N/A/sqft
$300 annually HOA
Neighborhood Data
Neighborhood data shown for ZIP Code: 78213, San Antonio, TX area.
Housing Distribution
Housing Statistics
| Category | Value |
|---|---|
| Total HU (Housing Units) | 17,468 (100%) |
| Owner Occupied HU | 7,841 (44.9%) |
| Renter Occupied HU | 7,808 (44.7%) |
| Vacant Housing Units | 1,819 (10.4%) |
| Median Home Value | $258,226 |
| Average Home Value | $322,878 |
Housing Distribution
Address Breakdown
Residential
17,521
Single Family
10,613
Multi-Family
6,908
Businesses
999


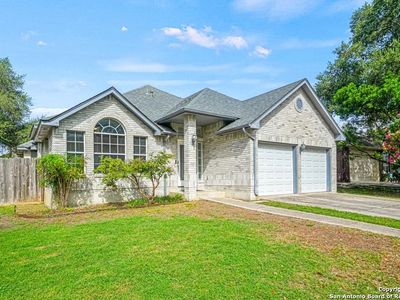
Nearby investment properties with comparable rents
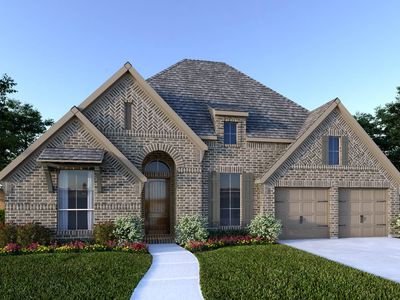
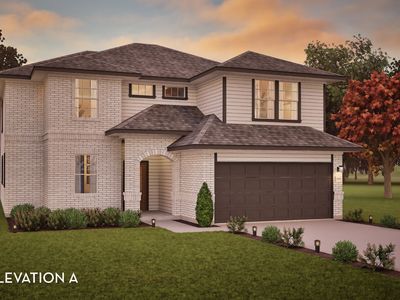
Nearby investment properties with comparable prices
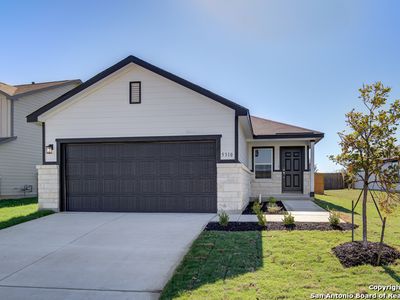

Ziffy AI Summary
A quick, investor-focused snapshot highlighting income strength, yield potential.
| Key metrics | Value |
|---|---|
| Price | $399,900 |
| Est. Rent | $3,200/mo |
| ROI | 18% |
- Attractive rent-to-price ratio for income stability
- Good fit for DSCR financing with healthy coverage
Townhouse
Built in 2023
6,534 sqft lot
$N/A/sqft
$300 annually HOA
Neighborhood Data
Neighborhood data shown for ZIP Code: 78213, San Antonio, TX area.
Housing Distribution
Housing Statistics
| Category | Value |
|---|---|
| Total HU (Housing Units) | 17,468 (100%) |
| Owner Occupied HU | 7,841 (44.9%) |
| Renter Occupied HU | 7,808 (44.7%) |
| Vacant Housing Units | 1,819 (10.4%) |
| Median Home Value | $258,226 |
| Average Home Value | $322,878 |
Housing Distribution
Address Breakdown
Residential
17,521
Single Family
10,613
Multi-Family
6,908
Businesses
999
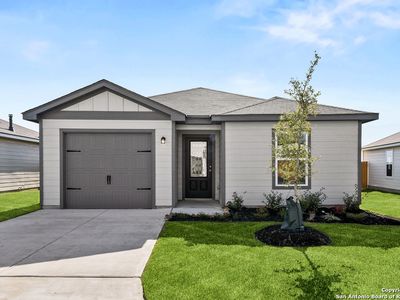
Nearby investment properties with comparable rents
Nearby investment properties with comparable prices