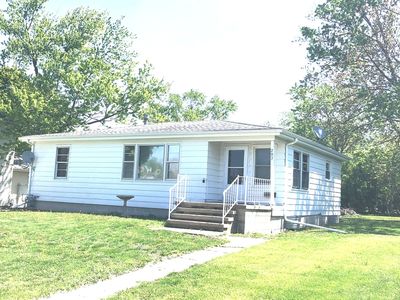
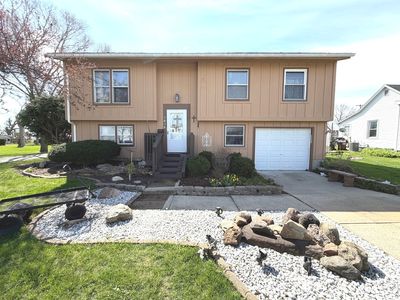
207 N Thomas StGilmanIL60938
INVESTMENT ANALYSIS
Investment Verdict
Appreciation PlayGlobal investors willing to prioritise equity over near-term yield will find 207 N Thomas St, Gilman, IL, 60938 in Gilman worth study. Rental yield 0%. The 0% gross yield is below cash-flow benchmarks at $137,000, but 5% annual appreciation, adding $37,851 over five years, frames this as a capital growth position. Rent of $0/mo partially offsets the $616/mo payment. Ziffy Mortgage finances appreciation-play properties (0.00 DSCR) for non-U.S. residents without domestic income documentation; a 30–35% down payment maximises coverage.
| This Property | City Avg | |
|---|---|---|
| Gross Rental Yield | 0% | 7.0% |
| Monthly Cash Flow | $0 | $300 |
City averages based on Gilman market data in our database. Property projections are estimates.
Single Family
Built in 1950
0.25 Acres lot
$N/A/sqft
No HOA
Neighborhood Data
Neighborhood data shown for ZIP Code: 60938, Gilman, IL area.
Housing Distribution
Housing Statistics
| Category | Value |
|---|---|
| Total HU (Housing Units) | 909 (100%) |
| Owner Occupied HU | 625 (68.8%) |
| Renter Occupied HU | 182 (20.0%) |
| Vacant Housing Units | 102 (11.2%) |
| Median Home Value | $133,026 |
| Average Home Value | $156,212 |
Housing Distribution
Address Breakdown
Residential
836
Single Family
821
Multi-Family
15
Businesses
109


Nearby investment properties with comparable rents
No similar rental properties found nearby.
Nearby investment properties with comparable prices

Ziffy AI Summary
A quick, investor-focused snapshot highlighting income strength, yield potential.
| Key metrics | Value |
|---|---|
| Price | $399,900 |
| Est. Rent | $3,200/mo |
| ROI | 18% |
- Attractive rent-to-price ratio for income stability
- Good fit for DSCR financing with healthy coverage
Single Family
Built in 1950
0.25 Acres lot
$N/A/sqft
No HOA
Neighborhood Data
Neighborhood data shown for ZIP Code: 60938, Gilman, IL area.
Housing Distribution
Housing Statistics
| Category | Value |
|---|---|
| Total HU (Housing Units) | 909 (100%) |
| Owner Occupied HU | 625 (68.8%) |
| Renter Occupied HU | 182 (20.0%) |
| Vacant Housing Units | 102 (11.2%) |
| Median Home Value | $133,026 |
| Average Home Value | $156,212 |
Housing Distribution
Address Breakdown
Residential
836
Single Family
821
Multi-Family
15
Businesses
109
Nearby investment properties with comparable rents
No similar rental properties found nearby.
Nearby investment properties with comparable prices