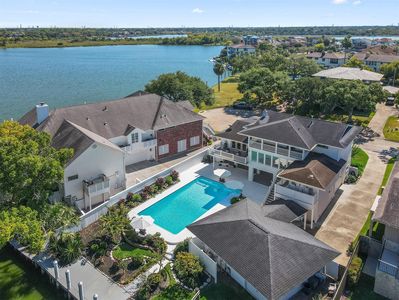
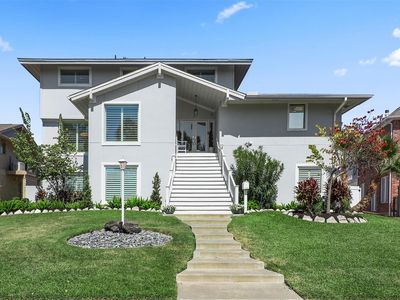
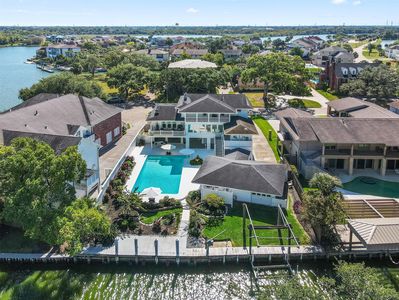
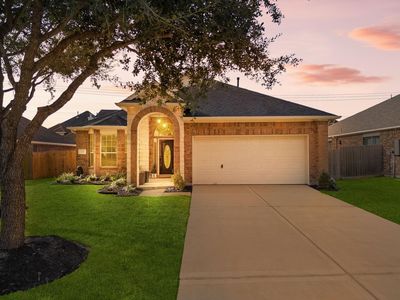
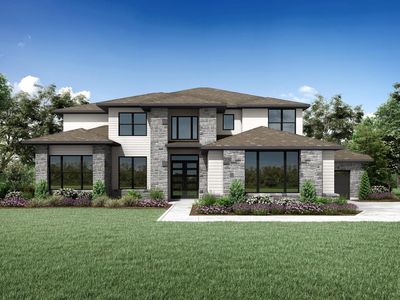
2011 Sea Cove CtHoustonTX77058
INVESTMENT ANALYSIS
Investment Verdict
Appreciation Play2011 Sea Cove Ct, Houston, TX, 77058 in Houston is priced for appreciation, not yield. Rental yield 4.21%. At $1,065,000 with a 4.21% gross yield, the monthly income is modest, but 5% annual price growth is projected to add $294,240 in value over five years, making equity the primary return driver. Ziffy Mortgage's DSCR mortgage (0.78) can still finance this property for non-U.S. residents; a 30–35% down payment typically produces the cleanest underwriting for appreciation-focused assets. Total projected cumulative return: $161,186.
| This Property | City Avg | |
|---|---|---|
| Gross Rental Yield | 4.2% | 6.2% |
| Monthly Cash Flow | $(3,849) | $450 |
City averages based on Houston market data in our database. Property projections are estimates.
DSCR Rental Loan Qualification
Qualifies using the property's rental income, not your personal income.
- ✓No W-2, pay stubs, or tax returns needed
- ✓Rental income qualifies you
- ✓Built for real estate investors
| Monthly Rental Income | $3,736 |
| Total Monthly Debt Service | $7,150 |
| DSCR Ratio | 0.52x |
Ziffy Mortgage typically prefers a DSCR of 1.0+, but in some cases you may qualify with a DSCR below 1. To explore if this deal qualifies for an investment mortgage, book time with your loan officer →
Estimates assume 6.0% rate / 30-yr fixed, 30% down, 1% tax, 0.5% insurance. Not a commitment to lend.
Single Family
Built in 1969
0.33 Acres lot
$N/A/sqft
No HOA
Neighborhood Data
Neighborhood data shown for ZIP Code: 77058, Houston, TX area.
Housing Distribution
Housing Statistics
| Category | Value |
|---|---|
| Total HU (Housing Units) | 10,594 (100%) |
| Owner Occupied HU | 3,382 (31.9%) |
| Renter Occupied HU | 6,079 (57.4%) |
| Vacant Housing Units | 1,133 (10.7%) |
| Median Home Value | $306,272 |
| Average Home Value | $351,134 |
Housing Distribution
Address Breakdown
Residential
10,791
Single Family
2,819
Multi-Family
7,972
Businesses
1,562


Nearby investment properties with comparable rents
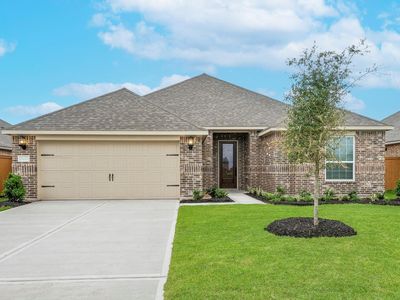
Nearby investment properties with comparable prices
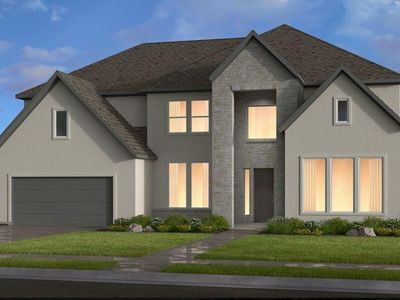

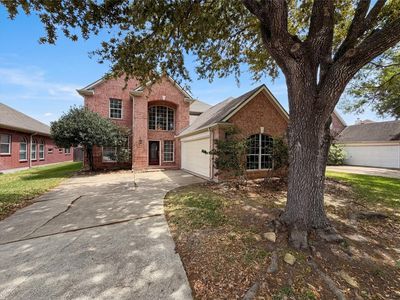
Ziffy AI Summary
A quick, investor-focused snapshot highlighting income strength, yield potential.
| Key metrics | Value |
|---|---|
| Price | $399,900 |
| Est. Rent | $3,200/mo |
| ROI | 18% |
- Attractive rent-to-price ratio for income stability
- Good fit for DSCR financing with healthy coverage
Single Family
Built in 1969
0.33 Acres lot
$N/A/sqft
No HOA
Neighborhood Data
Neighborhood data shown for ZIP Code: 77058, Houston, TX area.
Housing Distribution
Housing Statistics
| Category | Value |
|---|---|
| Total HU (Housing Units) | 10,594 (100%) |
| Owner Occupied HU | 3,382 (31.9%) |
| Renter Occupied HU | 6,079 (57.4%) |
| Vacant Housing Units | 1,133 (10.7%) |
| Median Home Value | $306,272 |
| Average Home Value | $351,134 |
Housing Distribution
Address Breakdown
Residential
10,791
Single Family
2,819
Multi-Family
7,972
Businesses
1,562
Nearby investment properties with comparable rents
Nearby investment properties with comparable prices