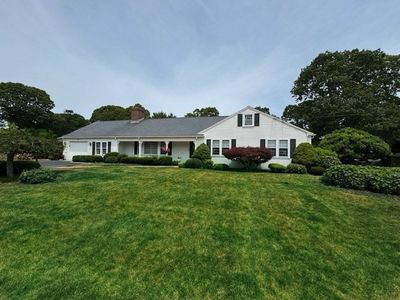
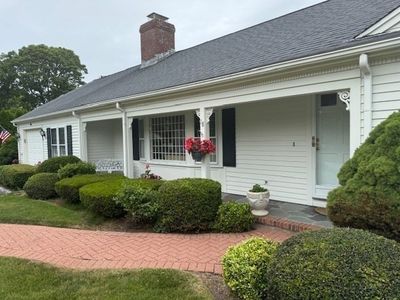
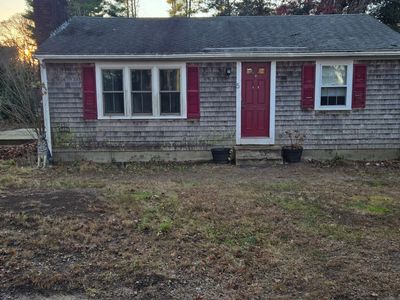
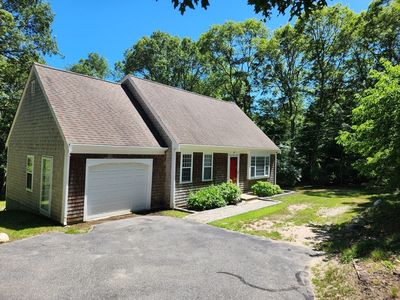
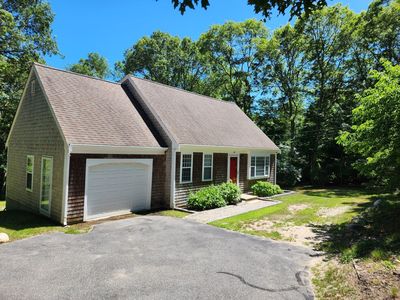
18 Lily Pond DrSouth YarmouthMA02664
INVESTMENT ANALYSIS
Investment Verdict
Appreciation PlayAt a 5.62% gross rental yield, 18 Lily Pond Dr, South Yarmouth, MA, 02664 in South Yarmouth is priced for capital growth, not immediate cash flow. The $735,000 purchase reflects market confidence in future value: at 5%/yr, the property is forecast to gain $203,067 by year five, with $6,769/yr in additional equity from loan paydown. Ziffy Mortgage's DSCR mortgage (1.04) qualifies for non-U.S. residents without personal income documents. Total five-year projected cumulative return: $201,911.
| This Property | City Avg | |
|---|---|---|
| Gross Rental Yield | 5.6% | 5.0% |
| Monthly Cash Flow | $(1,200) | $1,200 |
City averages based on South Yarmouth market data in our database. Property projections are estimates.
DSCR Rental Loan Qualification
Qualifies using the property's rental income, not your personal income.
- ✓No W-2, pay stubs, or tax returns needed
- ✓Rental income qualifies you
- ✓Built for real estate investors
| Monthly Rental Income | $3,443 |
| Total Monthly Debt Service | $4,351 |
| DSCR Ratio | 0.79x |
Ziffy Mortgage typically prefers a DSCR of 1.0+, but in some cases you may qualify with a DSCR below 1. To explore if this deal qualifies for an investment mortgage, book time with your loan officer →
Estimates assume 6.0% rate / 30-yr fixed, 30% down, 1% tax, 0.5% insurance. Not a commitment to lend.
Single Family
Built in 1970
0.26 Acres lot
$N/A/sqft
$125 annually HOA
Neighborhood Data
Neighborhood data shown for ZIP Code: 02664, South Yarmouth, MA area.
Housing Distribution
Housing Statistics
| Category | Value |
|---|---|
| Total HU (Housing Units) | 7,409 (100%) |
| Owner Occupied HU | 3,340 (45.1%) |
| Renter Occupied HU | 1,268 (17.1%) |
| Vacant Housing Units | 2,801 (37.8%) |
| Median Home Value | $650,913 |
| Average Home Value | $780,439 |
Housing Distribution
Address Breakdown
Residential
6,454
Single Family
5,964
Multi-Family
490
Businesses
539


Nearby investment properties with comparable rents
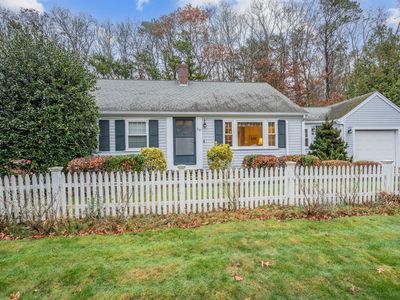
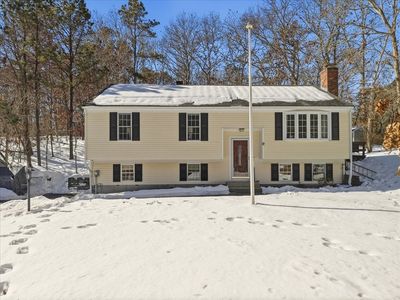
Nearby investment properties with comparable prices
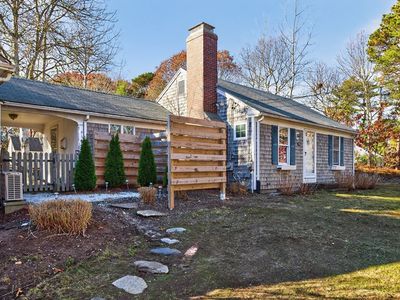

Ziffy AI Summary
A quick, investor-focused snapshot highlighting income strength, yield potential.
| Key metrics | Value |
|---|---|
| Price | $399,900 |
| Est. Rent | $3,200/mo |
| ROI | 18% |
- Attractive rent-to-price ratio for income stability
- Good fit for DSCR financing with healthy coverage
Single Family
Built in 1970
0.26 Acres lot
$N/A/sqft
$125 annually HOA
Neighborhood Data
Neighborhood data shown for ZIP Code: 02664, South Yarmouth, MA area.
Housing Distribution
Housing Statistics
| Category | Value |
|---|---|
| Total HU (Housing Units) | 7,409 (100%) |
| Owner Occupied HU | 3,340 (45.1%) |
| Renter Occupied HU | 1,268 (17.1%) |
| Vacant Housing Units | 2,801 (37.8%) |
| Median Home Value | $650,913 |
| Average Home Value | $780,439 |
Housing Distribution
Address Breakdown
Residential
6,454
Single Family
5,964
Multi-Family
490
Businesses
539
Nearby investment properties with comparable rents
Nearby investment properties with comparable prices
Listed by: Ghada Ponte • Ponte Realty
Mls Name: MLS PIN
Mls ID: #73394128
Disclaimer: The property listing data and information set forth herein were provided to MLS Property Information Network, Inc. from third party sources, including sellers, lessors and public records, and were compiled by MLS Property Information Network, Inc. The property listing data and information are for the personal, non commercial use of consumers having a good faith interest in purchasing or leasing listed properties of the type displayed to them and may not be used for any purpose other than to identify prospective properties which such consumers may have a good faith interest in purchasing or leasing. MLS Property Information Network, Inc. and its subscribers disclaim any and all representations and warranties as to the accuracy of the property listing data and information set forth herein. The MLS listing information displayed is deemed reliable, but is not guaranteed accurate by the MLS.