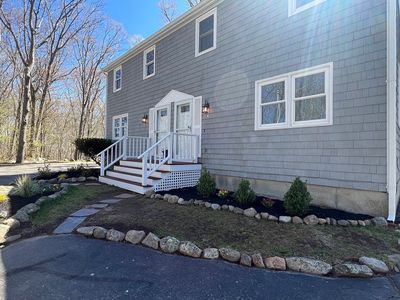
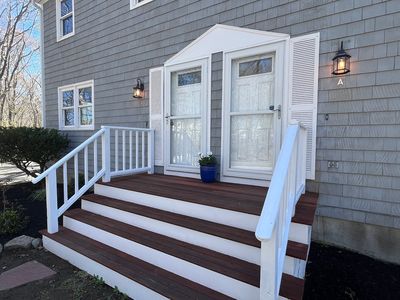
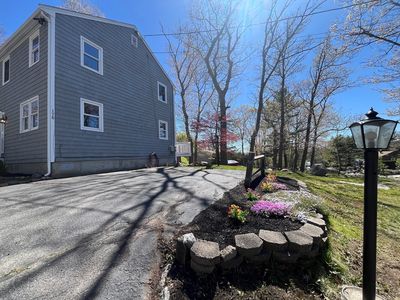
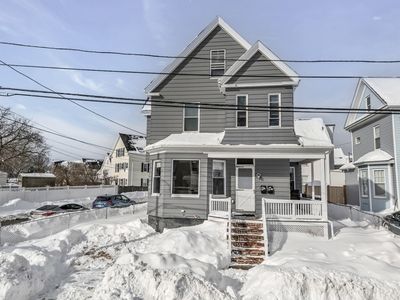
176 Main St #ARockportMA01966
INVESTMENT ANALYSIS
Investment Verdict
Strong Cash FlowIf cash-on-cash performance is your primary filter, 176 Main St #A, Rockport, MA, 01966 in Rockport deserves attention. This $465,000 property earns $4,610/mo in rent, a 11.9% gross yield, and nets $1,365/mo after the $2,091/mo payment. DSCR 2.20 makes it one of the cleaner DSCR underwriting candidates Ziffy Mortgage sees in this market. Five-year appreciation of $128,471 compounds alongside $4,283/yr in yearly equity build, for a total cumulative return of $284,634.
| This Property | City Avg | |
|---|---|---|
| Gross Rental Yield | 11.9% | 6.0% |
| Monthly Cash Flow | $1,365 | $1,200 |
City averages based on Rockport market data in our database. Property projections are estimates.
DSCR Rental Loan Qualification
Qualifies using the property's rental income, not your personal income.
- ✓No W-2, pay stubs, or tax returns needed
- ✓Rental income qualifies you
- ✓Built for real estate investors
| Monthly Rental Income | $4,610 |
| Total Monthly Debt Service | $2,746 |
| DSCR Ratio | 1.68x |
Ziffy Mortgage: Your DSCR most likely meets our 1.0+ requirement, so you'll most probably qualify for our standard DSCR investment loan program. To pre-qualify, book time with your loan officer →
Estimates assume 6.0% rate / 30-yr fixed, 30% down, 1% tax, 0.5% insurance. Not a commitment to lend.
Townhouse
Built in 1972
N/A lot
$N/A/sqft
No HOA
Neighborhood Data
Neighborhood data shown for ZIP Code: 01966, Rockport, MA area.
Housing Distribution
Housing Statistics
| Category | Value |
|---|---|
| Total HU (Housing Units) | 4,384 (100%) |
| Owner Occupied HU | 2,363 (53.9%) |
| Renter Occupied HU | 967 (22.1%) |
| Vacant Housing Units | 1,054 (24.0%) |
| Median Home Value | $764,205 |
| Average Home Value | $880,041 |
Housing Distribution
Address Breakdown
Residential
3,770
Single Family
3,582
Multi-Family
188
Businesses
348


Nearby investment properties with comparable rents


Nearby investment properties with comparable prices


Ziffy AI Summary
A quick, investor-focused snapshot highlighting income strength, yield potential.
| Key metrics | Value |
|---|---|
| Price | $399,900 |
| Est. Rent | $3,200/mo |
| ROI | 18% |
- Attractive rent-to-price ratio for income stability
- Good fit for DSCR financing with healthy coverage
Townhouse
Built in 1972
N/A lot
$N/A/sqft
No HOA
Neighborhood Data
Neighborhood data shown for ZIP Code: 01966, Rockport, MA area.
Housing Distribution
Housing Statistics
| Category | Value |
|---|---|
| Total HU (Housing Units) | 4,384 (100%) |
| Owner Occupied HU | 2,363 (53.9%) |
| Renter Occupied HU | 967 (22.1%) |
| Vacant Housing Units | 1,054 (24.0%) |
| Median Home Value | $764,205 |
| Average Home Value | $880,041 |
Housing Distribution
Address Breakdown
Residential
3,770
Single Family
3,582
Multi-Family
188
Businesses
348
Nearby investment properties with comparable rents
Nearby investment properties with comparable prices
Listed by: N/A • N/A
Mls Name: MLS PIN
Mls ID: #73516844