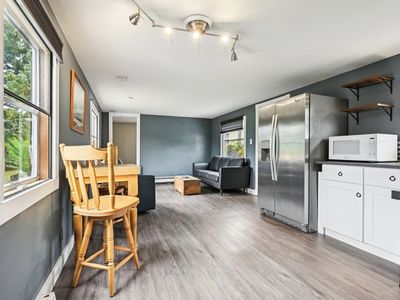
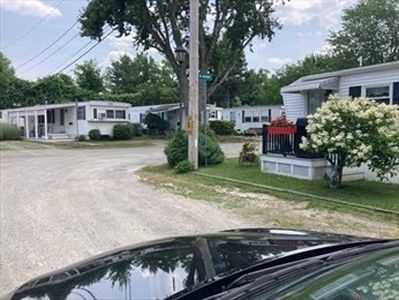
170 Rockland St #9HinghamMA02043
INVESTMENT ANALYSIS
Investment Verdict
Strong Cash FlowDay-one income is the story at 170 Rockland St #9, Hingham, MA, 02043 in Hingham. Priced at $164,700, it generates $5,345/mo in gross rent and $4,307/mo in net monthly cash flow, a 38.94% yield that comfortably supports the 7.21 DSCR needed for Ziffy Mortgage's no-W2 DSCR mortgage. Projected annual cash flow: $51,681. Five-year appreciation: $45,504. Equity from principal paydown: $1,517/yr. Total projected cumulative return: $339,719.
| This Property | City Avg | |
|---|---|---|
| Gross Rental Yield | 38.9% | 5.2% |
| Monthly Cash Flow | $4,307 | $500 |
City averages based on Hingham market data in our database. Property projections are estimates.
DSCR Rental Loan Qualification
Qualifies using the property's rental income, not your personal income.
- ✓No W-2, pay stubs, or tax returns needed
- ✓Rental income qualifies you
- ✓Built for real estate investors
| Monthly Rental Income | $5,345 |
| Total Monthly Debt Service | $973 |
| DSCR Ratio | 5.50x |
Ziffy Mortgage: Your DSCR most likely meets our 1.0+ requirement, so you'll most probably qualify for our standard DSCR investment loan program. To pre-qualify, book time with your loan officer →
Estimates assume 6.0% rate / 30-yr fixed, 30% down, 1% tax, 0.5% insurance. Not a commitment to lend.
Manufactured
Built in 1988
N/A lot
$N/A/sqft
No HOA
Neighborhood Data
Neighborhood data shown for ZIP Code: 02043, Hingham, MA area.
Housing Distribution
Housing Statistics
| Category | Value |
|---|---|
| Total HU (Housing Units) | 10,276 (100%) |
| Owner Occupied HU | 7,412 (72.1%) |
| Renter Occupied HU | 2,102 (20.5%) |
| Vacant Housing Units | 762 ( 7.4%) |
| Median Home Value | $1,169,044 |
| Average Home Value | $1,240,940 |
Housing Distribution
Address Breakdown
Residential
9,851
Single Family
7,644
Multi-Family
2,207
Businesses
1,116


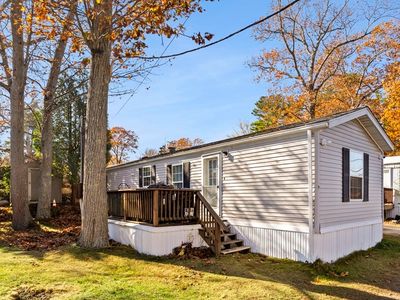
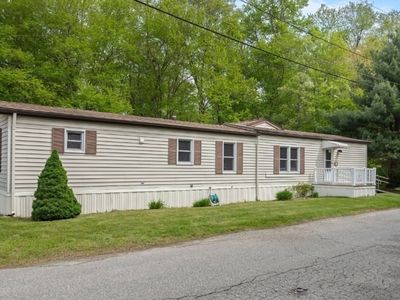
Nearby investment properties with comparable rents

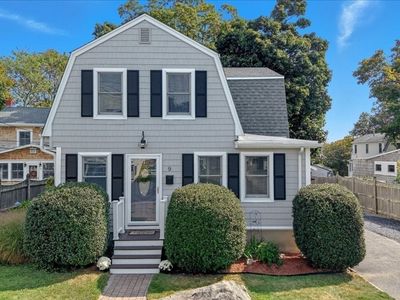
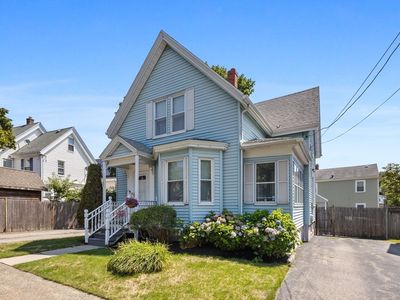
Nearby investment properties with comparable prices

Ziffy AI Summary
A quick, investor-focused snapshot highlighting income strength, yield potential.
| Key metrics | Value |
|---|---|
| Price | $399,900 |
| Est. Rent | $3,200/mo |
| ROI | 18% |
- Attractive rent-to-price ratio for income stability
- Good fit for DSCR financing with healthy coverage
Manufactured
Built in 1988
N/A lot
$N/A/sqft
No HOA
Neighborhood Data
Neighborhood data shown for ZIP Code: 02043, Hingham, MA area.
Housing Distribution
Housing Statistics
| Category | Value |
|---|---|
| Total HU (Housing Units) | 10,276 (100%) |
| Owner Occupied HU | 7,412 (72.1%) |
| Renter Occupied HU | 2,102 (20.5%) |
| Vacant Housing Units | 762 ( 7.4%) |
| Median Home Value | $1,169,044 |
| Average Home Value | $1,240,940 |
Housing Distribution
Address Breakdown
Residential
9,851
Single Family
7,644
Multi-Family
2,207
Businesses
1,116
Nearby investment properties with comparable rents
Nearby investment properties with comparable prices