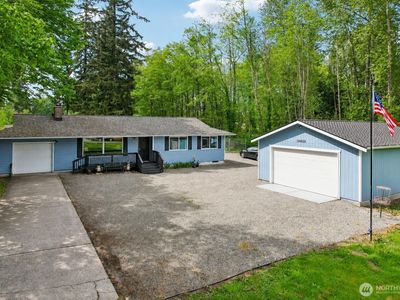
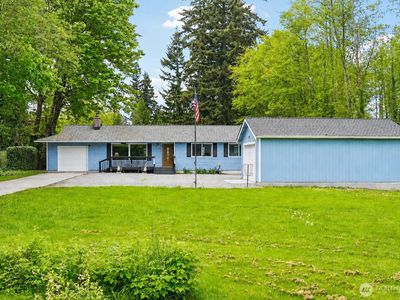
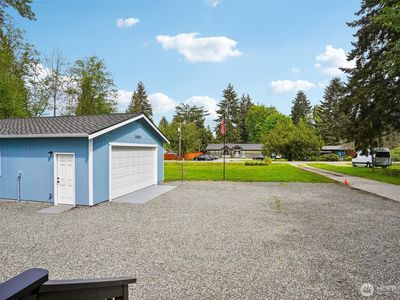
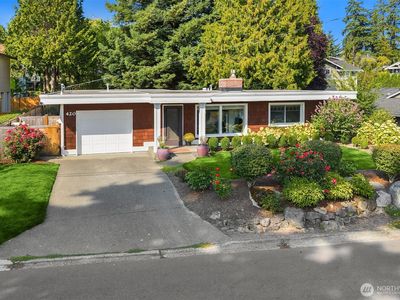
16625 190th AVE SERentonWA98058
INVESTMENT ANALYSIS
Investment Verdict
Steady Equity BuilderAt $599,000, 16625 190th AVE SE, Renton, WA, 98058 in Renton generates $3,670/mo in rent (7.35% yield) but nets only $69/mo after debt service. The spread is thin, manageable for investors comfortable with low-margin holds who are buying into the 5% annual appreciation thesis. Ziffy Mortgage's DSCR loan (1.36) allows non-U.S. residents to acquire without personal income checks. A larger down payment reduces the monthly debt load and widens the margin. Five-year appreciation: $165,493. Total projected return: $231,184.
| This Property | National Avg | |
|---|---|---|
| Gross Rental Yield | 7.4% | 6.2% |
| Monthly Cash Flow | $69 | $180 |
National averages based on 2024–2025 U.S. residential rental market data. Content is user-generated and unverified.
DSCR Rental Loan Qualification
Qualifies using the property's rental income, not your personal income.
- ✓No W-2, pay stubs, or tax returns needed
- ✓Rental income qualifies you
- ✓Built for real estate investors
| Monthly Rental Income | $3,670 |
| Total Monthly Debt Service | $3,362 |
| DSCR Ratio | 1.09x |
Ziffy Mortgage: Your DSCR most likely meets our 1.0+ requirement, so you'll most probably qualify for our standard DSCR investment loan program. To pre-qualify, book time with your loan officer →
Estimates assume 6.0% rate / 30-yr fixed, 30% down, 1% tax, 0.5% insurance. Not a commitment to lend.
Single Family
Built in 1969
0.69 Acres lot
$N/A/sqft
No HOA
Neighborhood Data
Neighborhood data shown for ZIP Code: 98058, Renton, WA area.
Housing Distribution
Housing Statistics
| Category | Value |
|---|---|
| Total HU (Housing Units) | 16,386 (100%) |
| Owner Occupied HU | 11,608 (70.8%) |
| Renter Occupied HU | 4,425 (27.0%) |
| Vacant Housing Units | 353 ( 2.2%) |
| Median Home Value | $678,214 |
| Average Home Value | $781,202 |
Housing Distribution
Address Breakdown
Residential
16,284
Single Family
14,090
Multi-Family
2,194
Businesses
498


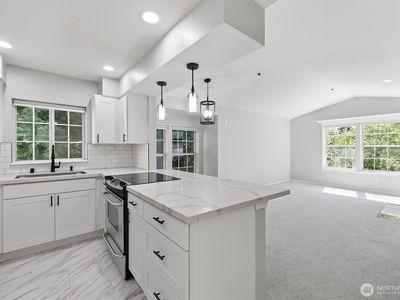
Nearby investment properties with comparable rents
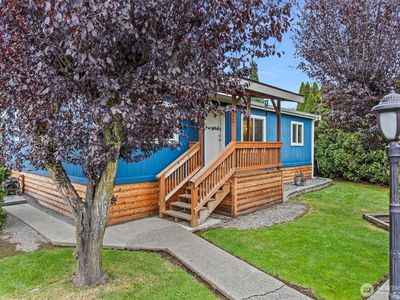
Nearby investment properties with comparable prices

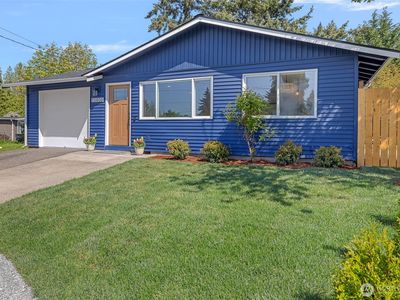
Ziffy AI Summary
A quick, investor-focused snapshot highlighting income strength, yield potential.
| Key metrics | Value |
|---|---|
| Price | $399,900 |
| Est. Rent | $3,200/mo |
| ROI | 18% |
- Attractive rent-to-price ratio for income stability
- Good fit for DSCR financing with healthy coverage
Single Family
Built in 1969
0.69 Acres lot
$N/A/sqft
No HOA
Neighborhood Data
Neighborhood data shown for ZIP Code: 98058, Renton, WA area.
Housing Distribution
Housing Statistics
| Category | Value |
|---|---|
| Total HU (Housing Units) | 16,386 (100%) |
| Owner Occupied HU | 11,608 (70.8%) |
| Renter Occupied HU | 4,425 (27.0%) |
| Vacant Housing Units | 353 ( 2.2%) |
| Median Home Value | $678,214 |
| Average Home Value | $781,202 |
Housing Distribution
Address Breakdown
Residential
16,284
Single Family
14,090
Multi-Family
2,194
Businesses
498
Nearby investment properties with comparable rents
Nearby investment properties with comparable prices
Listed by: Chris Gurnee • eXp Realty
Mls Name: NWMLS as distributed by MLS GRID
Mls Provider:
Mls ID: #2524134
Disclaimer: Based on information submitted to the MLS GRID as of 2026-05-16 17:29:33 PDT. All data is obtained from various sources and may not have been verified by broker or MLS GRID. Supplied Open House Information is subject to change without notice. All information should be independently reviewed and verified for accuracy. Properties may or may not be listed by the office/agent presenting the information. IDX information is provided exclusively for consumers personal noncommercial use, that it may not be used for any purpose other than to identify prospective properties consumers may be interested in purchasing, that the data is deemed reliable but is not guaranteed by MLS GRID. 2026 NWMLS [Click here for more information](/mls-disclaimers/#39)