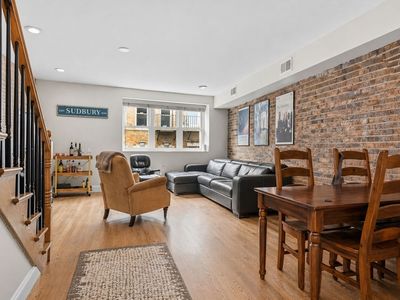
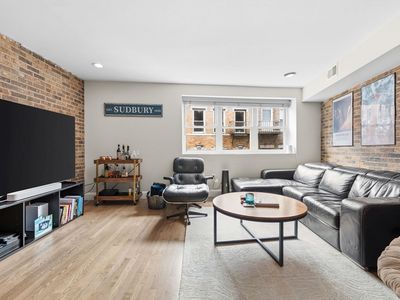
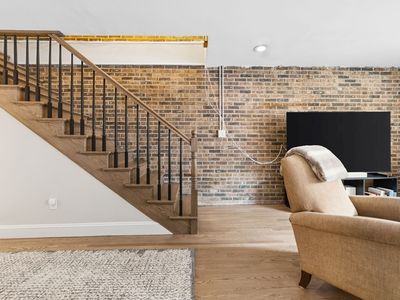
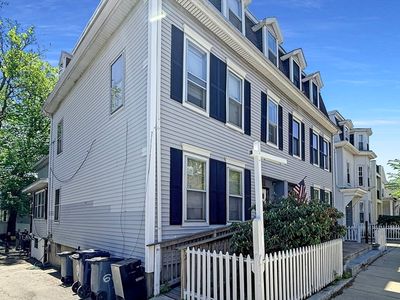
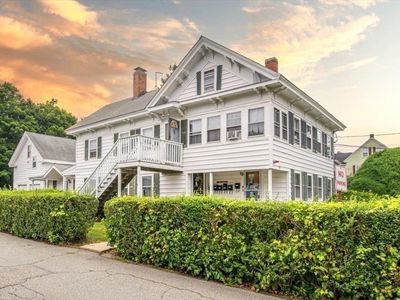
159 Salem St APT 4BostonMA02113
INVESTMENT ANALYSIS
Investment Verdict
Appreciation PlayMarkets with strong demand fundamentals often produce low-yield, high-appreciation assets. 159 Salem St APT 4, Boston, MA, 02113 in Boston fits: $1,750,000, 5.4% gross yield, and a projected 5% annual appreciation rate adding $483,493 in value within five years. Rental yield 5.4%. The narrow rent-to-debt spread is the trade-off for market growth. Ziffy Mortgage's DSCR loan (1.00) finances non-U.S. buyers without personal income documentation; optimise coverage with a 30–35% down payment. $16,118/yr in principal paydown and $483,493 in appreciation project a total return of $461,554.
| This Property | City Avg | |
|---|---|---|
| Gross Rental Yield | 5.4% | 4.2% |
| Monthly Cash Flow | $(3,643) | $1,850 |
City averages based on Boston market data in our database. Property projections are estimates.
DSCR Rental Loan Qualification
Qualifies using the property's rental income, not your personal income.
- ✓No W-2, pay stubs, or tax returns needed
- ✓Rental income qualifies you
- ✓Built for real estate investors
| Monthly Rental Income | $7,877 |
| Total Monthly Debt Service | $10,334 |
| DSCR Ratio | 0.76x |
Ziffy Mortgage typically prefers a DSCR of 1.0+, but in some cases you may qualify with a DSCR below 1. To explore if this deal qualifies for an investment mortgage, book time with your loan officer →
Estimates assume 6.0% rate / 30-yr fixed, 30% down, 1% tax, 0.5% insurance. Not a commitment to lend.
Condo
Built in 1890
N/A lot
$N/A/sqft
No HOA
Neighborhood Data
Neighborhood data shown for ZIP Code: 02113, Boston, MA area.
Housing Distribution
Housing Statistics
| Category | Value |
|---|---|
| Total HU (Housing Units) | 4,620 (100%) |
| Owner Occupied HU | 849 (18.4%) |
| Renter Occupied HU | 3,403 (73.7%) |
| Vacant Housing Units | 368 ( 8.0%) |
| Median Home Value | $864,083 |
| Average Home Value | $1,042,903 |
Housing Distribution
Address Breakdown
Residential
4,406
Single Family
626
Multi-Family
3,780
Businesses
350


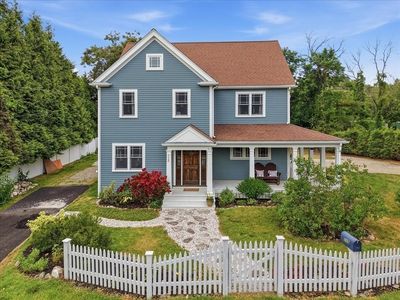
Nearby investment properties with comparable rents

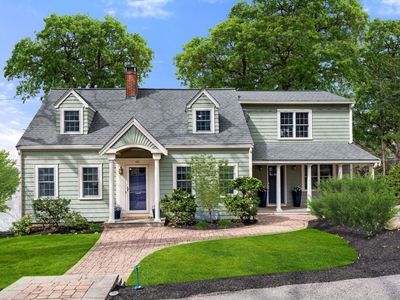
Nearby investment properties with comparable prices
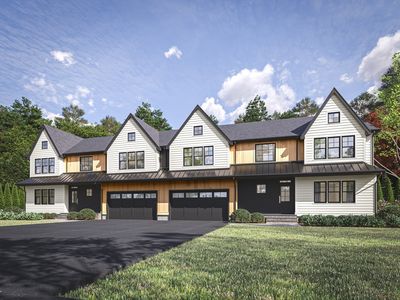

Ziffy AI Summary
A quick, investor-focused snapshot highlighting income strength, yield potential.
| Key metrics | Value |
|---|---|
| Price | $399,900 |
| Est. Rent | $3,200/mo |
| ROI | 18% |
- Attractive rent-to-price ratio for income stability
- Good fit for DSCR financing with healthy coverage
Condo
Built in 1890
N/A lot
$N/A/sqft
No HOA
Neighborhood Data
Neighborhood data shown for ZIP Code: 02113, Boston, MA area.
Housing Distribution
Housing Statistics
| Category | Value |
|---|---|
| Total HU (Housing Units) | 4,620 (100%) |
| Owner Occupied HU | 849 (18.4%) |
| Renter Occupied HU | 3,403 (73.7%) |
| Vacant Housing Units | 368 ( 8.0%) |
| Median Home Value | $864,083 |
| Average Home Value | $1,042,903 |
Housing Distribution
Address Breakdown
Residential
4,406
Single Family
626
Multi-Family
3,780
Businesses
350
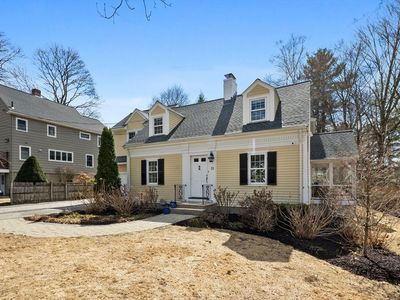
Nearby investment properties with comparable rents
Nearby investment properties with comparable prices
Listed by: N/A • N/A
Mls Name: MLS PIN
Mls ID: #73509321