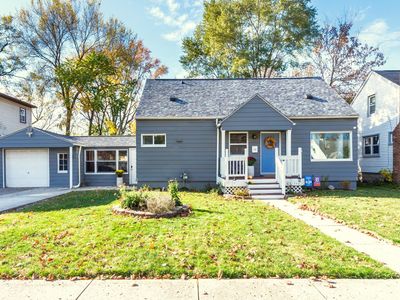
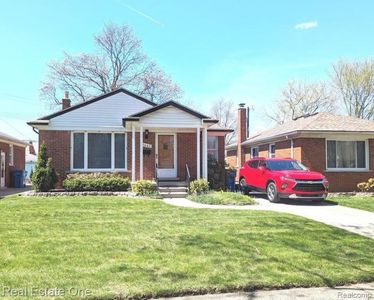
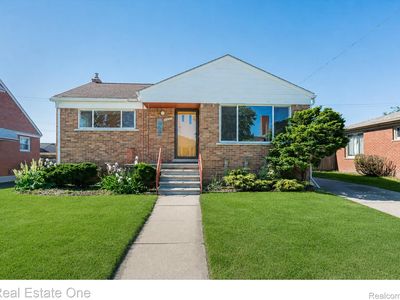
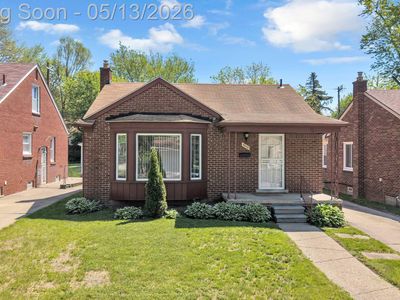
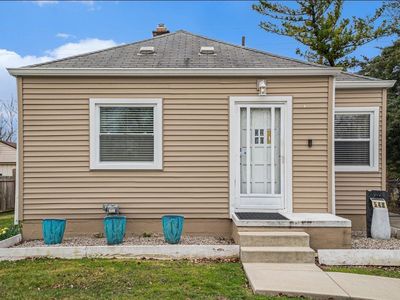
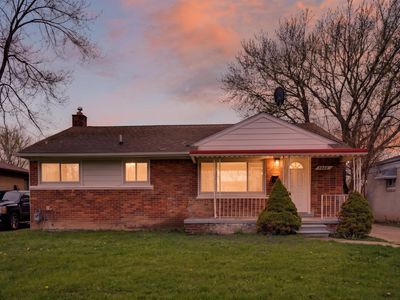
15433 NorborneRedfordMI48239
INVESTMENT ANALYSIS
Investment Verdict
Strong Cash Flow15433 Norborne, Redford, MI, 48239 in Redford earns its strong cash-flow label: 11.16% yield, $2,278/mo rent, $663/mo net income, DSCR 2.07. The $244,900 acquisition cost produces immediate returns that put this property in the top tier for U.S. income assets accessible via Ziffy Mortgage's rental-income underwriting. Long-term, 5% annual appreciation adds $67,661 by year five. Combined with $2,256/yr in principal paydown, total projected return reaches $135,991.
| This Property | City Avg | |
|---|---|---|
| Gross Rental Yield | 11.2% | 6.5% |
| Monthly Cash Flow | $663 | $150 |
City averages based on Redford market data in our database. Property projections are estimates.
DSCR Rental Loan Qualification
Qualifies using the property's rental income, not your personal income.
- ✓No W-2, pay stubs, or tax returns needed
- ✓Rental income qualifies you
- ✓Built for real estate investors
| Monthly Rental Income | $2,278 |
| Total Monthly Debt Service | $1,518 |
| DSCR Ratio | 1.50x |
Ziffy Mortgage: Your DSCR most likely meets our 1.0+ requirement, so you'll most probably qualify for our standard DSCR investment loan program. To pre-qualify, book time with your loan officer →
Estimates assume 6.0% rate / 30-yr fixed, 30% down, 1% tax, 0.5% insurance. Not a commitment to lend.
Single Family
Built in 1948
9,583 sqft lot
$N/A/sqft
No HOA
Neighborhood Data
Neighborhood data shown for ZIP Code: 48239, Redford, MI area.
Housing Distribution
Housing Statistics
| Category | Value |
|---|---|
| Total HU (Housing Units) | 15,269 (100%) |
| Owner Occupied HU | 11,232 (73.6%) |
| Renter Occupied HU | 3,490 (22.9%) |
| Vacant Housing Units | 547 ( 3.6%) |
| Median Home Value | $160,996 |
| Average Home Value | $202,329 |
Housing Distribution
Address Breakdown
Residential
15,044
Single Family
14,336
Multi-Family
708
Businesses
968


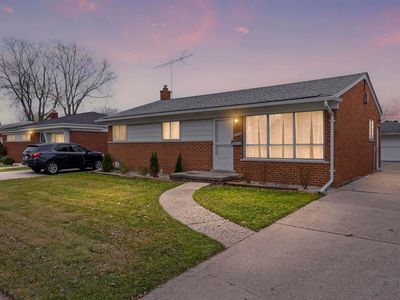
Nearby investment properties with comparable rents
Nearby investment properties with comparable prices
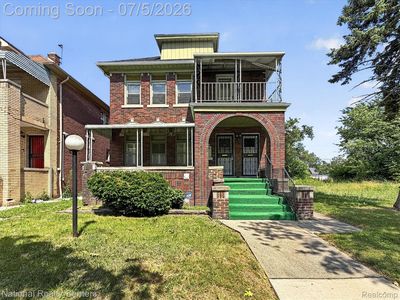

Ziffy AI Summary
A quick, investor-focused snapshot highlighting income strength, yield potential.
| Key metrics | Value |
|---|---|
| Price | $399,900 |
| Est. Rent | $3,200/mo |
| ROI | 18% |
- Attractive rent-to-price ratio for income stability
- Good fit for DSCR financing with healthy coverage
Single Family
Built in 1948
9,583 sqft lot
$N/A/sqft
No HOA
Neighborhood Data
Neighborhood data shown for ZIP Code: 48239, Redford, MI area.
Housing Distribution
Housing Statistics
| Category | Value |
|---|---|
| Total HU (Housing Units) | 15,269 (100%) |
| Owner Occupied HU | 11,232 (73.6%) |
| Renter Occupied HU | 3,490 (22.9%) |
| Vacant Housing Units | 547 ( 3.6%) |
| Median Home Value | $160,996 |
| Average Home Value | $202,329 |
Housing Distribution
Address Breakdown
Residential
15,044
Single Family
14,336
Multi-Family
708
Businesses
968
Nearby investment properties with comparable rents
Nearby investment properties with comparable prices