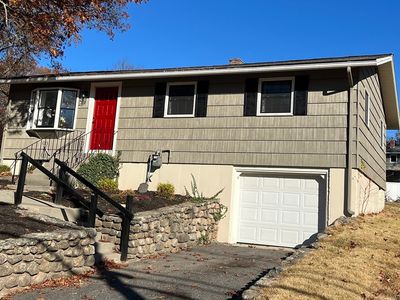
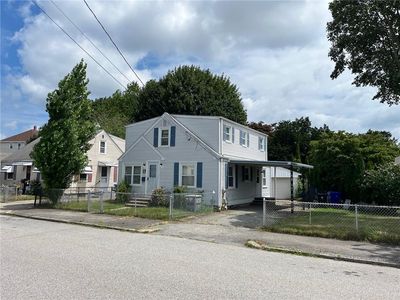
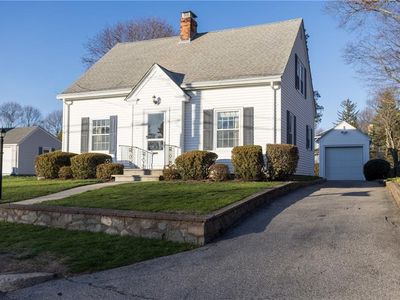
15 Farm StBellinghamMA02019
INVESTMENT ANALYSIS
Investment Verdict
Solid IncomeThe 8.04% yield at 15 Farm St, Bellingham, MA, 02019 in Bellingham is solid, but the $2,248/mo payment compresses net cash flow to $198/mo at $499,900. This is a tight-spread property, income covers debt, with little cushion. For investors who can optimise occupancy, the upside is real: 5% annual appreciation adds $138,113 by year five, and $4,604/yr in loan paydown builds equity. Ziffy Mortgage qualifies this via DSCR (1.49) without U.S. income documentation. Total projected return: $202,542.
| This Property | City Avg | |
|---|---|---|
| Gross Rental Yield | 8% | 5.8% |
| Monthly Cash Flow | $198 | $850 |
City averages based on Bellingham market data in our database. Property projections are estimates.
DSCR Loan Qualification
| Monthly Rental Income | $3,349 |
| Total Monthly Debt Service | $2,952 |
| DSCR Ratio | 1.13x |
Ziffy Mortgage: Your DSCR most likely meets our 1.0+ requirement, so you'll most probably qualify for our standard DSCR investment loan program. To pre-qualify, book time with your loan officer →
Estimates assume 6.0% rate / 30-yr fixed, 30% down, 1% tax, 0.5% insurance. Not a commitment to lend.
Single Family
Built in 1956
0.31 Acres lot
$N/A/sqft
No HOA
Neighborhood Data
Neighborhood data shown for ZIP Code: 02019, Bellingham, MA area.
Housing Distribution
Housing Statistics
| Category | Value |
|---|---|
| Total HU (Housing Units) | 7,025 (100%) |
| Owner Occupied HU | 5,643 (80.3%) |
| Renter Occupied HU | 1,183 (16.8%) |
| Vacant Housing Units | 199 ( 2.8%) |
| Median Home Value | $551,091 |
| Average Home Value | $735,060 |
Housing Distribution
Address Breakdown
Residential
6,922
Single Family
6,450
Multi-Family
472
Businesses
541


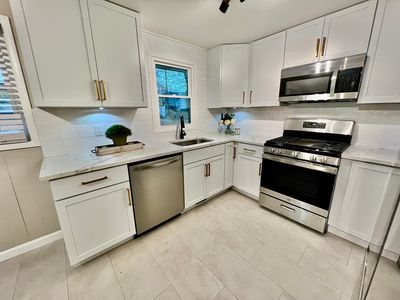
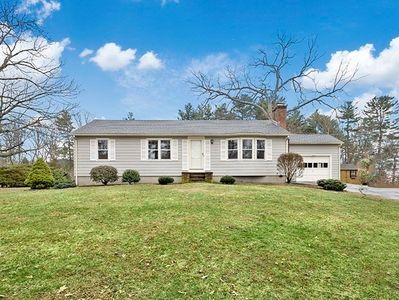
Nearby investment properties with comparable rents
Nearby investment properties with comparable prices


Ziffy AI Summary
A quick, investor-focused snapshot highlighting income strength, yield potential.
| Key metrics | Value |
|---|---|
| Price | $399,900 |
| Est. Rent | $3,200/mo |
| ROI | 18% |
- Attractive rent-to-price ratio for income stability
- Good fit for DSCR financing with healthy coverage
Single Family
Built in 1956
0.31 Acres lot
$N/A/sqft
No HOA
Neighborhood Data
Neighborhood data shown for ZIP Code: 02019, Bellingham, MA area.
Housing Distribution
Housing Statistics
| Category | Value |
|---|---|
| Total HU (Housing Units) | 7,025 (100%) |
| Owner Occupied HU | 5,643 (80.3%) |
| Renter Occupied HU | 1,183 (16.8%) |
| Vacant Housing Units | 199 ( 2.8%) |
| Median Home Value | $551,091 |
| Average Home Value | $735,060 |
Housing Distribution
Address Breakdown
Residential
6,922
Single Family
6,450
Multi-Family
472
Businesses
541
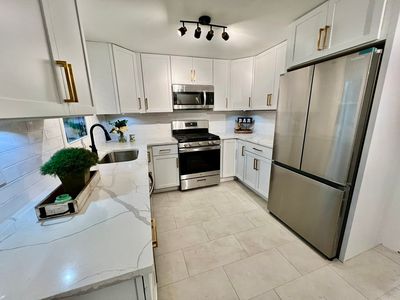
Nearby investment properties with comparable rents
Nearby investment properties with comparable prices