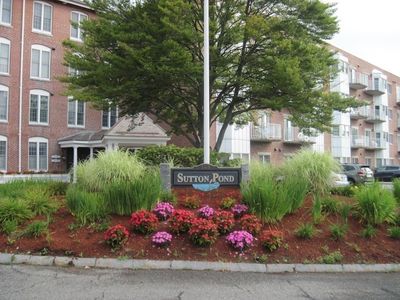
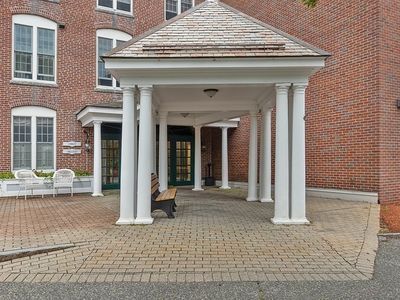
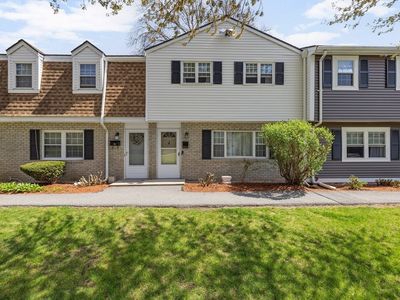
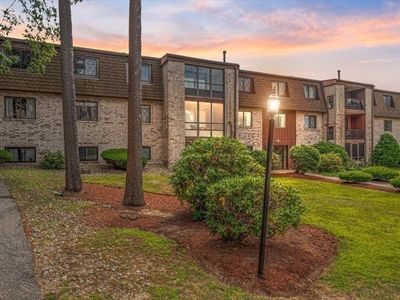
148 Main St APT O102North AndoverMA01845

INVESTMENT ANALYSIS
Investment Verdict
Strong Cash FlowStrong cash flow defines 148 Main St APT O102, North Andover, MA, 01845 in North Andover: $3,521/mo in rent, $874/mo net, 10.06% gross yield, all on a $420,000 acquisition. The 1.86 coverage ratio comfortably clears Ziffy Mortgage's threshold, enabling foreign-national buyers to close without U.S. credit documentation. Over five years, 5% appreciation adds $116,038 in value, and $3,868/yr in principal paydown steadily builds equity. Projected total cumulative return: $215,689.
| This Property | City Avg | |
|---|---|---|
| Gross Rental Yield | 10.1% | 5.5% |
| Monthly Cash Flow | $874 | $350 |
City averages based on North Andover market data in our database. Property projections are estimates.
DSCR Rental Loan Qualification
Qualifies using the property's rental income, not your personal income.
- ✓No W-2, pay stubs, or tax returns needed
- ✓Rental income qualifies you
- ✓Built for real estate investors
| Monthly Rental Income | $3,521 |
| Total Monthly Debt Service | $2,480 |
| DSCR Ratio | 1.42x |
Ziffy Mortgage: Your DSCR most likely meets our 1.0+ requirement, so you'll most probably qualify for our standard DSCR investment loan program. To pre-qualify, book time with your loan officer →
Estimates assume 6.0% rate / 30-yr fixed, 30% down, 1% tax, 0.5% insurance. Not a commitment to lend.
Townhouse
Built in 1994
N/A lot
$N/A/sqft
No HOA
Neighborhood Data
Neighborhood data shown for ZIP Code: 01845, North Andover, MA area.
Housing Distribution
Housing Statistics
| Category | Value |
|---|---|
| Total HU (Housing Units) | 12,358 (100%) |
| Owner Occupied HU | 8,307 (67.2%) |
| Renter Occupied HU | 3,501 (28.3%) |
| Vacant Housing Units | 550 ( 4.5%) |
| Median Home Value | $773,736 |
| Average Home Value | $807,808 |
Housing Distribution
Address Breakdown
Residential
12,197
Single Family
8,665
Multi-Family
3,532
Businesses
1,177


Nearby investment properties with comparable rents
Nearby investment properties with comparable prices


Ziffy AI Summary
A quick, investor-focused snapshot highlighting income strength, yield potential.
| Key metrics | Value |
|---|---|
| Price | $399,900 |
| Est. Rent | $3,200/mo |
| ROI | 18% |
- Attractive rent-to-price ratio for income stability
- Good fit for DSCR financing with healthy coverage
Townhouse
Built in 1994
N/A lot
$N/A/sqft
No HOA
Neighborhood Data
Neighborhood data shown for ZIP Code: 01845, North Andover, MA area.
Housing Distribution
Housing Statistics
| Category | Value |
|---|---|
| Total HU (Housing Units) | 12,358 (100%) |
| Owner Occupied HU | 8,307 (67.2%) |
| Renter Occupied HU | 3,501 (28.3%) |
| Vacant Housing Units | 550 ( 4.5%) |
| Median Home Value | $773,736 |
| Average Home Value | $807,808 |
Housing Distribution
Address Breakdown
Residential
12,197
Single Family
8,665
Multi-Family
3,532
Businesses
1,177
Nearby investment properties with comparable rents
Nearby investment properties with comparable prices
Listed by: Alliance Home Team • Elite Realty Experts, LLC
Mls Name: MLS PIN
Mls ID: #73423425