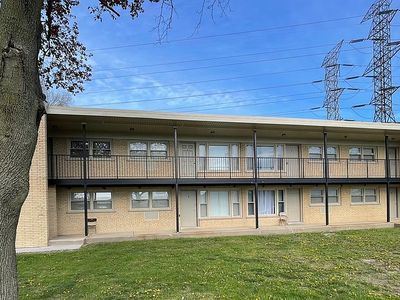
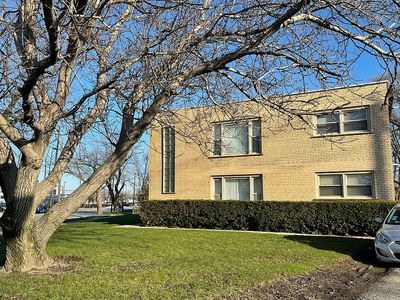
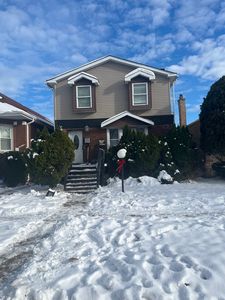
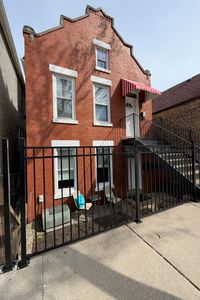
13729 S Brainard AveChicagoIL60633
INVESTMENT ANALYSIS
Investment Verdict
Appreciation PlayGlobal investors willing to prioritise equity over near-term yield will find 13729 S Brainard Ave, Chicago, IL, 60633 in Chicago worth study. Rental yield 1.72%. The 1.72% gross yield is below cash-flow benchmarks at $950,000, but 5% annual appreciation, adding $262,467 over five years, frames this as a capital growth position. Rent of $1,360/mo partially offsets the $4,272/mo payment. Ziffy Mortgage finances appreciation-play properties (0.32 DSCR) for non-U.S. residents without domestic income documentation; a 30–35% down payment maximises coverage. Total projected return: $26,823.
| This Property | City Avg | |
|---|---|---|
| Gross Rental Yield | 1.7% | 6.1% |
| Monthly Cash Flow | $(5,230) | $850 |
City averages based on Chicago market data in our database. Property projections are estimates.
DSCR Rental Loan Qualification
Qualifies using the property's rental income, not your personal income.
- ✓No W-2, pay stubs, or tax returns needed
- ✓Rental income qualifies you
- ✓Built for real estate investors
| Monthly Rental Income | $1,360 |
| Total Monthly Debt Service | $6,211 |
| DSCR Ratio | 0.22x |
Ziffy Mortgage typically prefers a DSCR of 1.0+, but in some cases you may qualify with a DSCR below 1. To explore if this deal qualifies for an investment mortgage, book time with your loan officer →
Estimates assume 6.0% rate / 30-yr fixed, 30% down, 1% tax, 0.5% insurance. Not a commitment to lend.
Multi Family
Built in 1964
0.37 Acres lot
$N/A/sqft
No HOA
Neighborhood Data
Neighborhood data shown for ZIP Code: 60633, Chicago, IL area.
Housing Distribution
Housing Statistics
| Category | Value |
|---|---|
| Total HU (Housing Units) | 5,328 (100%) |
| Owner Occupied HU | 3,297 (61.9%) |
| Renter Occupied HU | 1,558 (29.2%) |
| Vacant Housing Units | 473 ( 8.9%) |
| Median Home Value | $179,476 |
| Average Home Value | $222,473 |
Housing Distribution
Address Breakdown
Residential
5,013
Single Family
4,538
Multi-Family
475
Businesses
206


Nearby investment properties with comparable rents
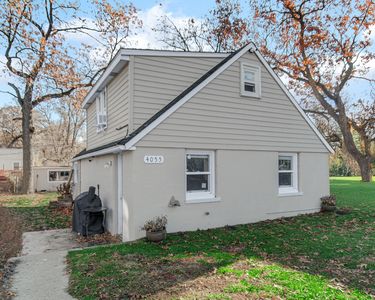
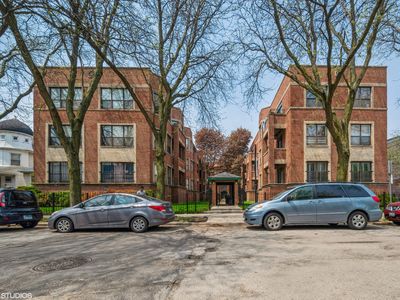
Nearby investment properties with comparable prices

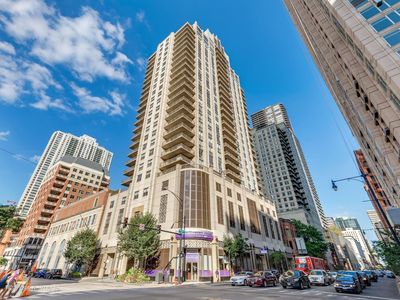
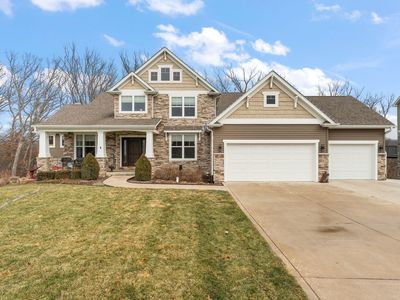

Ziffy AI Summary
A quick, investor-focused snapshot highlighting income strength, yield potential.
| Key metrics | Value |
|---|---|
| Price | $399,900 |
| Est. Rent | $3,200/mo |
| ROI | 18% |
- Attractive rent-to-price ratio for income stability
- Good fit for DSCR financing with healthy coverage
Multi Family
Built in 1964
0.37 Acres lot
$N/A/sqft
No HOA
Neighborhood Data
Neighborhood data shown for ZIP Code: 60633, Chicago, IL area.
Housing Distribution
Housing Statistics
| Category | Value |
|---|---|
| Total HU (Housing Units) | 5,328 (100%) |
| Owner Occupied HU | 3,297 (61.9%) |
| Renter Occupied HU | 1,558 (29.2%) |
| Vacant Housing Units | 473 ( 8.9%) |
| Median Home Value | $179,476 |
| Average Home Value | $222,473 |
Housing Distribution
Address Breakdown
Residential
5,013
Single Family
4,538
Multi-Family
475
Businesses
206
Nearby investment properties with comparable rents
Nearby investment properties with comparable prices