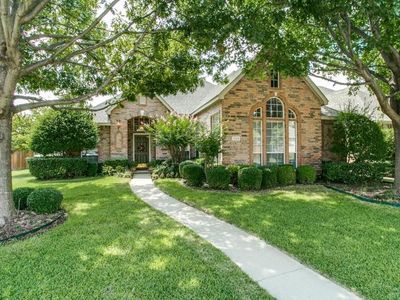
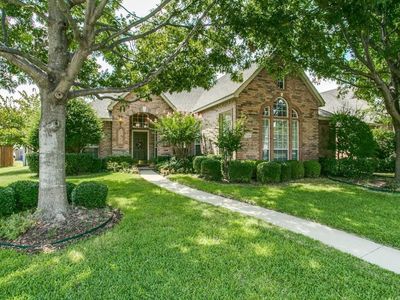
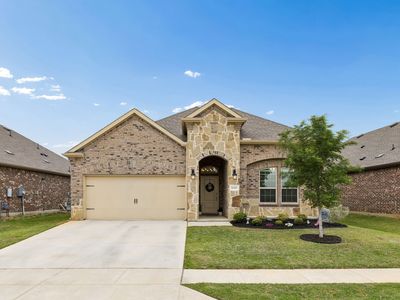
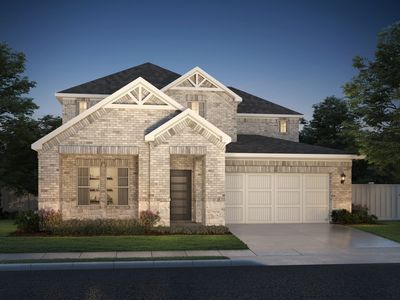
1329 Sherman CtAllenTX75013
INVESTMENT ANALYSIS
Investment Verdict
Steady Equity BuilderThere's a case for owning boring assets in strong markets. Rental yield 7.12%. It won't spike overnight, but it will produce quarter after quarter of U.S. dollar income with long-run appreciation. Ziffy Mortgage's DSCR loan removes U.S. income documentation barriers for non-residents. Five-year appreciation of $140,296 and $4,677/yr in equity build project total return of $143,480.
| This Property | National Avg | |
|---|---|---|
| Gross Rental Yield | 7.1% | 6.2% |
| Monthly Cash Flow | $(809) | $180 |
National averages based on 2024–2025 U.S. residential rental market data. Content is user-generated and unverified.
DSCR Rental Loan Qualification
Qualifies using the property's rental income, not your personal income.
- ✓No W-2, pay stubs, or tax returns needed
- ✓Rental income qualifies you
- ✓Built for real estate investors
| Monthly Rental Income | $3,012 |
| Total Monthly Debt Service | $3,619 |
| DSCR Ratio | 0.83x |
Ziffy Mortgage typically prefers a DSCR of 1.0+, but in some cases you may qualify with a DSCR below 1. To explore if this deal qualifies for an investment mortgage, book time with your loan officer →
Estimates assume 6.0% rate / 30-yr fixed, 30% down, 1% tax, 0.5% insurance. Not a commitment to lend.
Single Family
Built in 1995
8,276 sqft lot
$N/A/sqft
$143 monthly HOA
Neighborhood Data
Neighborhood data shown for ZIP Code: 75013, Allen, TX area.
Housing Distribution
Housing Statistics
| Category | Value |
|---|---|
| Total HU (Housing Units) | 21,738 (100%) |
| Owner Occupied HU | 12,605 (58.0%) |
| Renter Occupied HU | 7,807 (35.9%) |
| Vacant Housing Units | 1,326 ( 6.1%) |
| Median Home Value | $657,310 |
| Average Home Value | $697,117 |
Housing Distribution
Address Breakdown
Residential
20,972
Single Family
13,971
Multi-Family
7,001
Businesses
2,119


Nearby investment properties with comparable rents
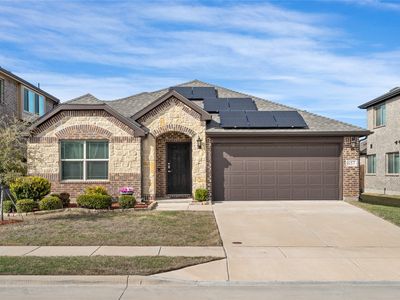
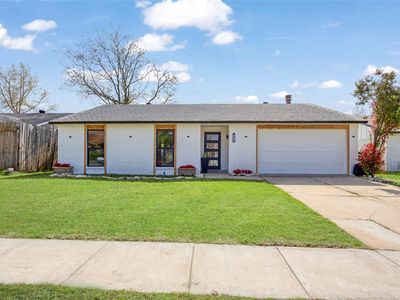
Nearby investment properties with comparable prices


Ziffy AI Summary
A quick, investor-focused snapshot highlighting income strength, yield potential.
| Key metrics | Value |
|---|---|
| Price | $399,900 |
| Est. Rent | $3,200/mo |
| ROI | 18% |
- Attractive rent-to-price ratio for income stability
- Good fit for DSCR financing with healthy coverage
Single Family
Built in 1995
8,276 sqft lot
$N/A/sqft
$143 monthly HOA
Neighborhood Data
Neighborhood data shown for ZIP Code: 75013, Allen, TX area.
Housing Distribution
Housing Statistics
| Category | Value |
|---|---|
| Total HU (Housing Units) | 21,738 (100%) |
| Owner Occupied HU | 12,605 (58.0%) |
| Renter Occupied HU | 7,807 (35.9%) |
| Vacant Housing Units | 1,326 ( 6.1%) |
| Median Home Value | $657,310 |
| Average Home Value | $697,117 |
Housing Distribution
Address Breakdown
Residential
20,972
Single Family
13,971
Multi-Family
7,001
Businesses
2,119
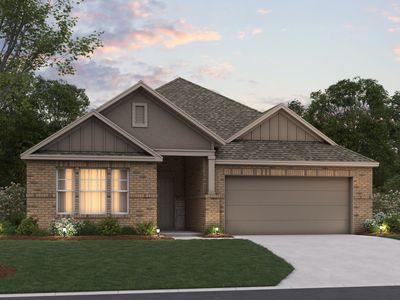
Nearby investment properties with comparable rents
Nearby investment properties with comparable prices