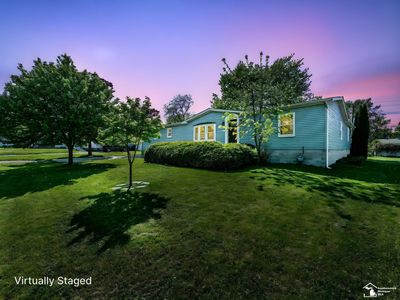
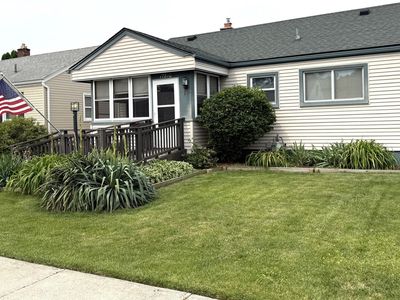
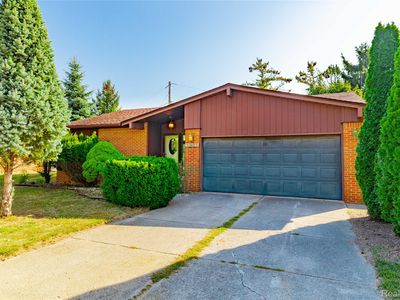
13243 Beaubien StSouth RockwoodMI48179
INVESTMENT ANALYSIS
Investment Verdict
Solid IncomeReliable, bankable, and well-priced, 13243 Beaubien St, South Rockwood, MI, 48179 in South Rockwood delivers $2,255/mo in gross rent and $337/mo in net monthly income at a $277,420 entry. The 9.3% yield and 1.81 DSCR make it a clean candidate for Ziffy Mortgage's DSCR loan; no W-2s or U.S. credit history required. With 5% annual appreciation projecting $76,646 over five years and $2,555/yr in equity from loan paydown, total projected return is $132,533.
| This Property | City Avg | |
|---|---|---|
| Gross Rental Yield | 9.3% | 8.0% |
| Monthly Cash Flow | $337 | $450 |
City averages based on South Rockwood market data in our database. Property projections are estimates.
DSCR Rental Loan Qualification
Qualifies using the property's rental income, not your personal income.
- ✓No W-2, pay stubs, or tax returns needed
- ✓Rental income qualifies you
- ✓Built for real estate investors
| Monthly Rental Income | $2,255 |
| Total Monthly Debt Service | $1,729 |
| DSCR Ratio | 1.30x |
Ziffy Mortgage: Your DSCR most likely meets our 1.0+ requirement, so you'll most probably qualify for our standard DSCR investment loan program. To pre-qualify, book time with your loan officer →
Estimates assume 6.0% rate / 30-yr fixed, 30% down, 1% tax, 0.5% insurance. Not a commitment to lend.
Single Family
Built in 1998
0.41 Acres lot
$N/A/sqft
No HOA
Neighborhood Data
Neighborhood data shown for ZIP Code: 48179, South Rockwood, MI area.
Housing Distribution
Housing Statistics
| Category | Value |
|---|---|
| Total HU (Housing Units) | 1,463 (100%) |
| Owner Occupied HU | 1,085 (74.2%) |
| Renter Occupied HU | 296 (20.2%) |
| Vacant Housing Units | 82 ( 5.6%) |
| Median Home Value | $317,474 |
| Average Home Value | $348,190 |
Housing Distribution
Address Breakdown
Residential
1,349
Single Family
1,349
Multi-Family
0
Businesses
58


Nearby investment properties with comparable rents
Nearby investment properties with comparable prices

Ziffy AI Summary
A quick, investor-focused snapshot highlighting income strength, yield potential.
| Key metrics | Value |
|---|---|
| Price | $399,900 |
| Est. Rent | $3,200/mo |
| ROI | 18% |
- Attractive rent-to-price ratio for income stability
- Good fit for DSCR financing with healthy coverage
Single Family
Built in 1998
0.41 Acres lot
$N/A/sqft
No HOA
Neighborhood Data
Neighborhood data shown for ZIP Code: 48179, South Rockwood, MI area.
Housing Distribution
Housing Statistics
| Category | Value |
|---|---|
| Total HU (Housing Units) | 1,463 (100%) |
| Owner Occupied HU | 1,085 (74.2%) |
| Renter Occupied HU | 296 (20.2%) |
| Vacant Housing Units | 82 ( 5.6%) |
| Median Home Value | $317,474 |
| Average Home Value | $348,190 |
Housing Distribution
Address Breakdown
Residential
1,349
Single Family
1,349
Multi-Family
0
Businesses
58
Nearby investment properties with comparable rents
Nearby investment properties with comparable prices
Listed by: Deborah Lambrix • eXp Realty LLC in Monroe
Mls Name: MiRealSource
Mls Provider:
Mls ID: #50175025
Disclaimer: Source MLS: MiRealSource Provided through IDX via MiRealSource. Courtesy of MiRealSource Shareholder. Copyright MiRealSource. The information published and disseminated by MiRealSource is communicated verbatim, without change by MiRealSource, as filed with MiRealSource by its members. The accuracy of all information, regardless of source, is not guaranteed or warranted. All information should be independently verified. Copyright 2025 MiRealSource. All rights reserved. The information provided hereby constitutes proprietary information of MiRealSource, Inc. and its shareholders, affiliates and licensees and may not be reproduced or transmitted in any form or by any means, electronic or mechanical, including photocopy, recording, scanning or any information storage and retrieval system, without written permission from MiRealSource, Inc. [Click here for more information](/mls-disclaimers/#261)