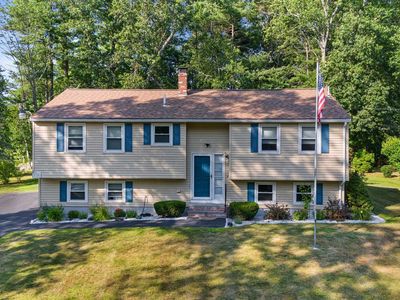
12 75th StNewburyportMA01950


INVESTMENT ANALYSIS
Investment Verdict
Appreciation Play12 75th St, Newburyport, MA, 01950 in Newburyport is priced for appreciation, not yield. Rental yield 2.89%. At $1,875,000 with a 2.89% gross yield, the monthly income is modest, but 5% annual price growth is projected to add $518,028 in value over five years, making equity the primary return driver. Ziffy Mortgage's DSCR mortgage (0.54) can still finance this property for non-U.S. residents; a 30–35% down payment typically produces the cleanest underwriting for appreciation-focused assets. Total projected cumulative return: $241,793.
| This Property | City Avg | |
|---|---|---|
| Gross Rental Yield | 2.9% | 6.0% |
| Monthly Cash Flow | $(7,306) | $350 |
City averages based on Newburyport market data in our database. Property projections are estimates.
DSCR Rental Loan Qualification
Qualifies using the property's rental income, not your personal income.
- ✓No W-2, pay stubs, or tax returns needed
- ✓Rental income qualifies you
- ✓Built for real estate investors
| Monthly Rental Income | $4,512 |
| Total Monthly Debt Service | $11,072 |
| DSCR Ratio | 0.41x |
Ziffy Mortgage typically prefers a DSCR of 1.0+, but in some cases you may qualify with a DSCR below 1. To explore if this deal qualifies for an investment mortgage, book time with your loan officer →
Estimates assume 6.0% rate / 30-yr fixed, 30% down, 1% tax, 0.5% insurance. Not a commitment to lend.
Single Family
Built in 2013
5,220 sqft lot
$N/A/sqft
No HOA
Neighborhood Data
Neighborhood data shown for ZIP Code: 01950, Newburyport, MA area.
Housing Distribution
Housing Statistics
| Category | Value |
|---|---|
| Total HU (Housing Units) | 8,760 (100%) |
| Owner Occupied HU | 6,027 (68.8%) |
| Renter Occupied HU | 2,087 (23.8%) |
| Vacant Housing Units | 646 ( 7.4%) |
| Median Home Value | $877,535 |
| Average Home Value | $942,557 |
Housing Distribution
Address Breakdown
Residential
8,654
Single Family
7,256
Multi-Family
1,398
Businesses
1,272


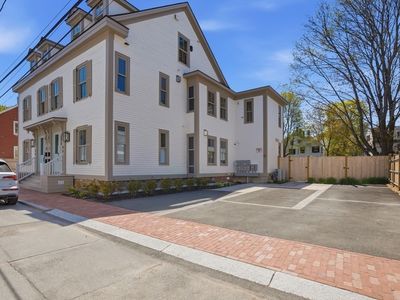
Nearby investment properties with comparable rents


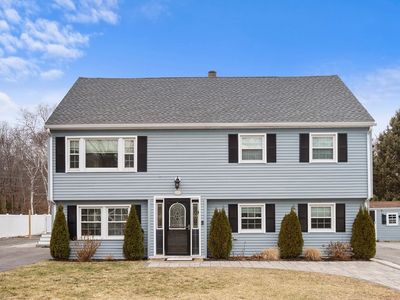
Nearby investment properties with comparable prices


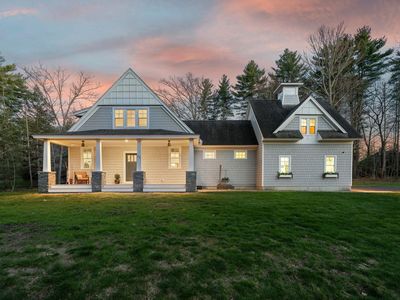

Ziffy AI Summary
A quick, investor-focused snapshot highlighting income strength, yield potential.
| Key metrics | Value |
|---|---|
| Price | $399,900 |
| Est. Rent | $3,200/mo |
| ROI | 18% |
- Attractive rent-to-price ratio for income stability
- Good fit for DSCR financing with healthy coverage
Single Family
Built in 2013
5,220 sqft lot
$N/A/sqft
No HOA
Neighborhood Data
Neighborhood data shown for ZIP Code: 01950, Newburyport, MA area.
Housing Distribution
Housing Statistics
| Category | Value |
|---|---|
| Total HU (Housing Units) | 8,760 (100%) |
| Owner Occupied HU | 6,027 (68.8%) |
| Renter Occupied HU | 2,087 (23.8%) |
| Vacant Housing Units | 646 ( 7.4%) |
| Median Home Value | $877,535 |
| Average Home Value | $942,557 |
Housing Distribution
Address Breakdown
Residential
8,654
Single Family
7,256
Multi-Family
1,398
Businesses
1,272
Nearby investment properties with comparable rents
Nearby investment properties with comparable prices