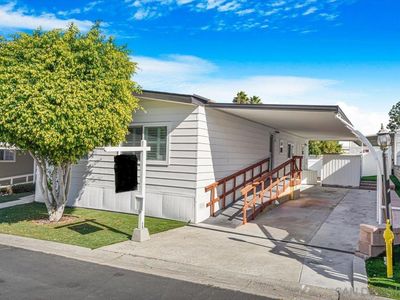
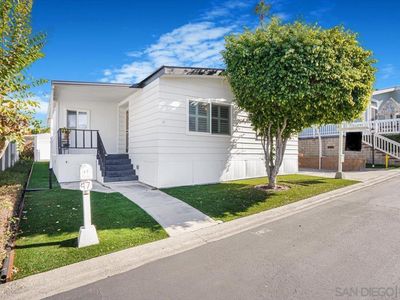
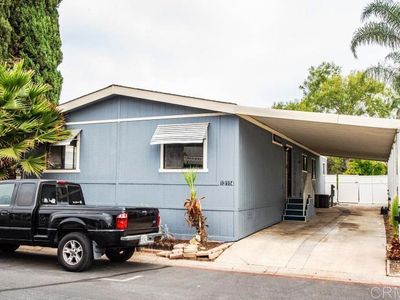
1145 E Barham Dr SPC 47San MarcosCA92078
INVESTMENT ANALYSIS
Investment Verdict
Solid IncomeThe income profile at 1145 E Barham Dr SPC 47, San Marcos, CA, 92078 in San Marcos is straightforward: $308,900 in, $2,209/mo in rent, $298/mo out after debt service. The 8.58% gross yield and 1.59 DSCR make this exactly the kind of asset Ziffy Mortgage finances for non-U.S. residents without income documentation. Appreciation at 5%/yr adds $85,343 by year five. With $2,845/yr in principal equity, the total cumulative return is projected at $136,355.
| This Property | City Avg | |
|---|---|---|
| Gross Rental Yield | 8.6% | 6.5% |
| Monthly Cash Flow | $298 | $300 |
City averages based on San Marcos market data in our database. Property projections are estimates.
DSCR Rental Loan Qualification
Qualifies using the property's rental income, not your personal income.
- ✓No W-2, pay stubs, or tax returns needed
- ✓Rental income qualifies you
- ✓Built for real estate investors
| Monthly Rental Income | $2,209 |
| Total Monthly Debt Service | $1,788 |
| DSCR Ratio | 1.24x |
Ziffy Mortgage: Your DSCR most likely meets our 1.0+ requirement, so you'll most probably qualify for our standard DSCR investment loan program. To pre-qualify, book time with your loan officer →
Estimates assume 6.0% rate / 30-yr fixed, 30% down, 1% tax, 0.5% insurance. Not a commitment to lend.
Manufactured
Built in 1977
N/A lot
$N/A/sqft
No HOA
Neighborhood Data
Neighborhood data shown for ZIP Code: 92078, San Marcos, CA area.
Housing Distribution
Housing Statistics
| Category | Value |
|---|---|
| Total HU (Housing Units) | 19,488 (100%) |
| Owner Occupied HU | 12,924 (66.3%) |
| Renter Occupied HU | 5,628 (28.9%) |
| Vacant Housing Units | 936 ( 4.8%) |
| Median Home Value | $963,925 |
| Average Home Value | $1,041,277 |
Housing Distribution
Address Breakdown
Residential
18,839
Single Family
16,170
Multi-Family
2,669
Businesses
1,462


Nearby investment properties with comparable rents
Nearby investment properties with comparable prices

Ziffy AI Summary
A quick, investor-focused snapshot highlighting income strength, yield potential.
| Key metrics | Value |
|---|---|
| Price | $399,900 |
| Est. Rent | $3,200/mo |
| ROI | 18% |
- Attractive rent-to-price ratio for income stability
- Good fit for DSCR financing with healthy coverage
Manufactured
Built in 1977
N/A lot
$N/A/sqft
No HOA
Neighborhood Data
Neighborhood data shown for ZIP Code: 92078, San Marcos, CA area.
Housing Distribution
Housing Statistics
| Category | Value |
|---|---|
| Total HU (Housing Units) | 19,488 (100%) |
| Owner Occupied HU | 12,924 (66.3%) |
| Renter Occupied HU | 5,628 (28.9%) |
| Vacant Housing Units | 936 ( 4.8%) |
| Median Home Value | $963,925 |
| Average Home Value | $1,041,277 |
Housing Distribution
Address Breakdown
Residential
18,839
Single Family
16,170
Multi-Family
2,669
Businesses
1,462
Nearby investment properties with comparable rents
Nearby investment properties with comparable prices
Listed by: Cyd Panaccione • HomeSmart Realty West
Mls Name: SDMLS
Mls Provider:
Mls ID: #240026729
Disclaimer: This information is deemed reliable but not guaranteed. You should rely on this information only to decide whether or not to further investigate a particular property. BEFORE MAKING ANY OTHER DECISION, YOU SHOULD PERSONALLY INVESTIGATE THE FACTS (e.g. square footage and lot size) with the assistance of an appropriate professional. You may use this information only to identify properties you may be interested in investigating further. All uses except for personal, noncommercial use in accordance with the foregoing purpose are prohibited. Redistribution or copying of this information, any photographs or video tours is strictly prohibited. This information is derived from the Internet Data Exchange (IDX) service provided by San Diego MLS. Displayed property listings may be held by a brokerage firm other than the broker and/or agent responsible for this display. The information and any photographs and video tours and the compilation from which they are derived is protected by copyright. Compilation 2025 San Diego MLS.