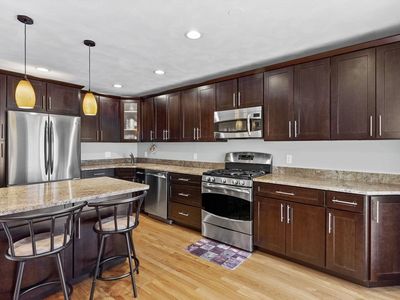
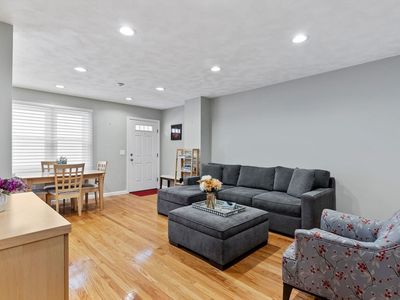
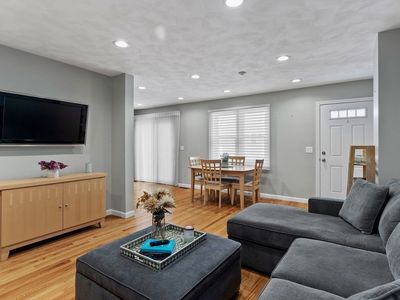
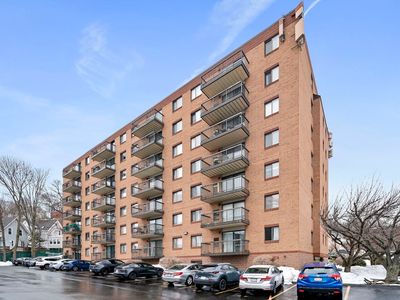
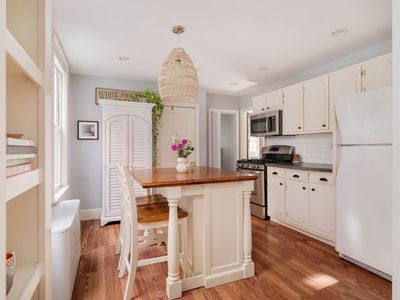
112 Lowell St APT 17PeabodyMA01960
INVESTMENT ANALYSIS
Investment Verdict
Solid IncomeThe income profile at 112 Lowell St APT 17, Peabody, MA, 01960 in Peabody is straightforward: $485,000 in, $3,790/mo in rent, $229/mo out after debt service. The 9.38% gross yield and 1.74 DSCR make this exactly the kind of asset Ziffy Mortgage finances for non-U.S. residents without income documentation. Appreciation at 5%/yr adds $133,997 by year five. With $4,467/yr in principal equity, the total cumulative return is projected at $201,069.
| This Property | City Avg | |
|---|---|---|
| Gross Rental Yield | 9.4% | 5.9% |
| Monthly Cash Flow | $229 | $850 |
City averages based on Peabody market data in our database. Property projections are estimates.
DSCR Loan Qualification
| Monthly Rental Income | $3,790 |
| Total Monthly Debt Service | $3,368 |
| DSCR Ratio | 1.13x |
Ziffy Mortgage: Your DSCR most likely meets our 1.0+ requirement, so you'll most probably qualify for our standard DSCR investment loan program. To pre-qualify, book time with your loan officer →
Estimates assume 6.0% rate / 30-yr fixed, 30% down, 1% tax, 0.5% insurance. Not a commitment to lend.
Townhouse
Built in 1987
N/A lot
$N/A/sqft
$504 monthly HOA
Neighborhood Data
Neighborhood data shown for ZIP Code: 01960, Peabody, MA area.
Housing Distribution
Housing Statistics
| Category | Value |
|---|---|
| Total HU (Housing Units) | 23,336 (100%) |
| Owner Occupied HU | 14,624 (62.7%) |
| Renter Occupied HU | 7,863 (33.7%) |
| Vacant Housing Units | 849 ( 3.6%) |
| Median Home Value | $634,604 |
| Average Home Value | $657,731 |
Housing Distribution
Address Breakdown
Residential
22,180
Single Family
16,670
Multi-Family
5,510
Businesses
1,989


Nearby investment properties with comparable rents
Nearby investment properties with comparable prices


Ziffy AI Summary
A quick, investor-focused snapshot highlighting income strength, yield potential.
| Key metrics | Value |
|---|---|
| Price | $399,900 |
| Est. Rent | $3,200/mo |
| ROI | 18% |
- Attractive rent-to-price ratio for income stability
- Good fit for DSCR financing with healthy coverage
Townhouse
Built in 1987
N/A lot
$N/A/sqft
$504 monthly HOA
Neighborhood Data
Neighborhood data shown for ZIP Code: 01960, Peabody, MA area.
Housing Distribution
Housing Statistics
| Category | Value |
|---|---|
| Total HU (Housing Units) | 23,336 (100%) |
| Owner Occupied HU | 14,624 (62.7%) |
| Renter Occupied HU | 7,863 (33.7%) |
| Vacant Housing Units | 849 ( 3.6%) |
| Median Home Value | $634,604 |
| Average Home Value | $657,731 |
Housing Distribution
Address Breakdown
Residential
22,180
Single Family
16,670
Multi-Family
5,510
Businesses
1,989
Nearby investment properties with comparable rents
Nearby investment properties with comparable prices
Listed by: Wilson Group • Keller Williams Realty
Mls Name: MLS PIN
Mls ID: #73343981
Disclaimer: The property listing data and information set forth herein were provided to MLS Property Information Network, Inc. from third party sources, including sellers, lessors and public records, and were compiled by MLS Property Information Network, Inc. The property listing data and information are for the personal, non commercial use of consumers having a good faith interest in purchasing or leasing listed properties of the type displayed to them and may not be used for any purpose other than to identify prospective properties which such consumers may have a good faith interest in purchasing or leasing. MLS Property Information Network, Inc. and its subscribers disclaim any and all representations and warranties as to the accuracy of the property listing data and information set forth herein.