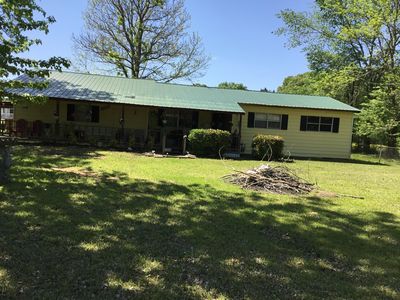
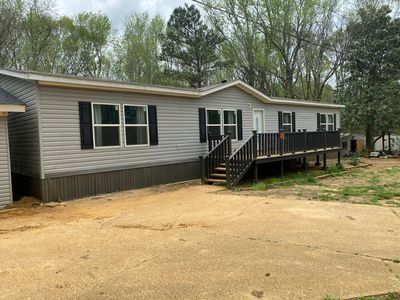
1112 E Bankhead StNew AlbanyMS38652

INVESTMENT ANALYSIS
Investment Verdict
Strong Cash FlowIf cash-on-cash performance is your primary filter, 1112 E Bankhead St, New Albany, MS, 38652 in New Albany deserves attention. This $173,000 property earns $1,728/mo in rent, a 11.99% gross yield, and nets $669/mo after the $778/mo payment. DSCR 2.22 makes it one of the cleaner DSCR underwriting candidates Ziffy Mortgage sees in this market. Five-year appreciation of $47,797 compounds alongside $1,593/yr in yearly equity build, for a total cumulative return of $108,661.
| This Property | National Avg | |
|---|---|---|
| Gross Rental Yield | 12% | 6.2% |
| Monthly Cash Flow | $669 | $180 |
National averages based on 2024–2025 U.S. residential rental market data. Content is user-generated and unverified.
DSCR Loan Qualification
| Monthly Rental Income | $1,728 |
| Total Monthly Debt Service | $990 |
| DSCR Ratio | 1.75x |
Ziffy Mortgage: Your DSCR most likely meets our 1.0+ requirement, so you'll most probably qualify for our standard DSCR investment loan program. To pre-qualify, book time with your loan officer →
Estimates assume 6.0% rate / 30-yr fixed, 30% down, 1% tax, 0.5% insurance. Not a commitment to lend.
Single Family
Built in N/A
N/A lot
$N/A/sqft
No HOA
Neighborhood Data
Neighborhood data shown for ZIP Code: 38652, New Albany, MS area.
Housing Distribution
Housing Statistics
| Category | Value |
|---|---|
| Total HU (Housing Units) | 7,643 (100%) |
| Owner Occupied HU | 5,086 (66.5%) |
| Renter Occupied HU | 1,831 (24.0%) |
| Vacant Housing Units | 726 ( 9.5%) |
| Median Home Value | $176,246 |
| Average Home Value | $225,845 |
Housing Distribution
Address Breakdown
Residential
7,117
Single Family
6,950
Multi-Family
167
Businesses
843


Nearby investment properties with comparable rents

Nearby investment properties with comparable prices
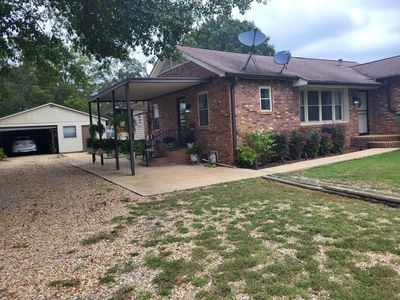

Ziffy AI Summary
A quick, investor-focused snapshot highlighting income strength, yield potential.
| Key metrics | Value |
|---|---|
| Price | $399,900 |
| Est. Rent | $3,200/mo |
| ROI | 18% |
- Attractive rent-to-price ratio for income stability
- Good fit for DSCR financing with healthy coverage
Single Family
Built in N/A
N/A lot
$N/A/sqft
No HOA
Neighborhood Data
Neighborhood data shown for ZIP Code: 38652, New Albany, MS area.
Housing Distribution
Housing Statistics
| Category | Value |
|---|---|
| Total HU (Housing Units) | 7,643 (100%) |
| Owner Occupied HU | 5,086 (66.5%) |
| Renter Occupied HU | 1,831 (24.0%) |
| Vacant Housing Units | 726 ( 9.5%) |
| Median Home Value | $176,246 |
| Average Home Value | $225,845 |
Housing Distribution
Address Breakdown
Residential
7,117
Single Family
6,950
Multi-Family
167
Businesses
843
Nearby investment properties with comparable rents
Nearby investment properties with comparable prices
Listed by: N/A • N/A
Mls Name: undefined
Mls ID: #N/A