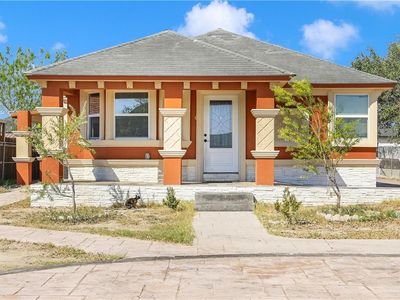
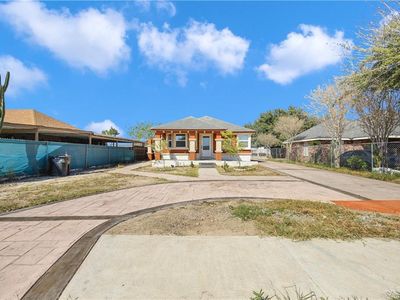
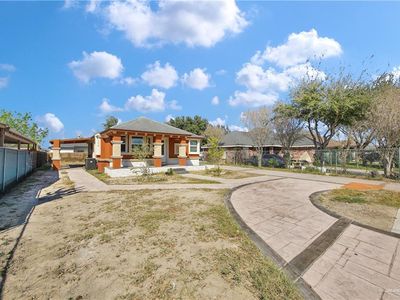
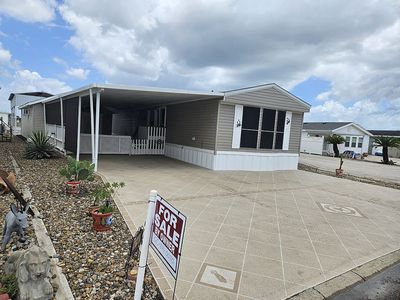
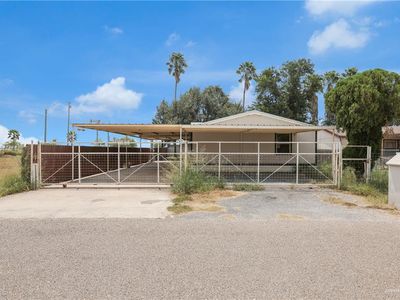
1109 W Garfield AveMissionTX78573
INVESTMENT ANALYSIS
Investment Verdict
Solid IncomeThe cash-flow margin at 1109 W Garfield Ave, Mission, TX, 78573 in Mission is narrow, $101/mo net on $1,168/mo rent after the $674/mo debt service, but the property operates at break-even-plus, not a loss. At $150,000 with a 9.34% yield, the long-run equity case via 5% appreciation ($41,442 over five years) and $1,382/yr in principal paydown is where the returns accumulate. Ziffy Mortgage's 1.73 DSCR loan requires no W-2s or U.S. credit. Total projected cumulative return: $64,052.
| This Property | National Avg | |
|---|---|---|
| Gross Rental Yield | 9.3% | 6.2% |
| Monthly Cash Flow | $101 | $180 |
National averages based on 2024–2025 U.S. residential rental market data. Content is user-generated and unverified.
DSCR Rental Loan Qualification
Qualifies using the property's rental income, not your personal income.
- ✓No W-2, pay stubs, or tax returns needed
- ✓Rental income qualifies you
- ✓Built for real estate investors
| Monthly Rental Income | $1,168 |
| Total Monthly Debt Service | $1,007 |
| DSCR Ratio | 1.16x |
Ziffy Mortgage: Your DSCR most likely meets our 1.0+ requirement, so you'll most probably qualify for our standard DSCR investment loan program. To pre-qualify, book time with your loan officer →
Estimates assume 6.0% rate / 30-yr fixed, 30% down, 1% tax, 0.5% insurance. Not a commitment to lend.
Single Family
Built in 2009
7,013 sqft lot
$N/A/sqft
No HOA
Neighborhood Data
Neighborhood data shown for ZIP Code: 78573, Mission, TX area.
Housing Distribution
Housing Statistics
| Category | Value |
|---|---|
| Total HU (Housing Units) | 14,379 (100%) |
| Owner Occupied HU | 9,397 (65.4%) |
| Renter Occupied HU | 3,749 (26.1%) |
| Vacant Housing Units | 1,233 ( 8.6%) |
| Median Home Value | $191,448 |
| Average Home Value | $242,363 |
Housing Distribution
Address Breakdown
Residential
13,981
Single Family
13,419
Multi-Family
562
Businesses
797


Nearby investment properties with comparable rents
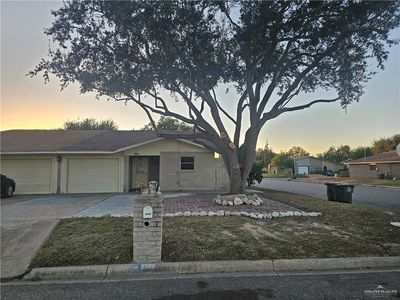
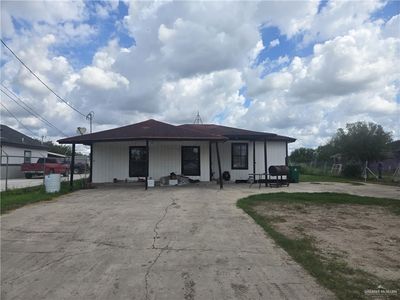
Nearby investment properties with comparable prices

Ziffy AI Summary
A quick, investor-focused snapshot highlighting income strength, yield potential.
| Key metrics | Value |
|---|---|
| Price | $399,900 |
| Est. Rent | $3,200/mo |
| ROI | 18% |
- Attractive rent-to-price ratio for income stability
- Good fit for DSCR financing with healthy coverage
Single Family
Built in 2009
7,013 sqft lot
$N/A/sqft
No HOA
Neighborhood Data
Neighborhood data shown for ZIP Code: 78573, Mission, TX area.
Housing Distribution
Housing Statistics
| Category | Value |
|---|---|
| Total HU (Housing Units) | 14,379 (100%) |
| Owner Occupied HU | 9,397 (65.4%) |
| Renter Occupied HU | 3,749 (26.1%) |
| Vacant Housing Units | 1,233 ( 8.6%) |
| Median Home Value | $191,448 |
| Average Home Value | $242,363 |
Housing Distribution
Address Breakdown
Residential
13,981
Single Family
13,419
Multi-Family
562
Businesses
797
Nearby investment properties with comparable rents
Nearby investment properties with comparable prices