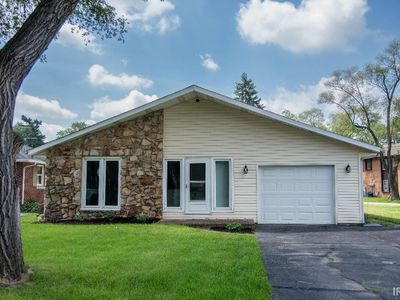
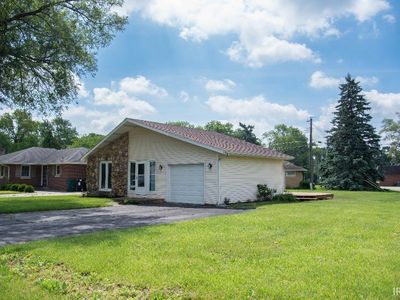
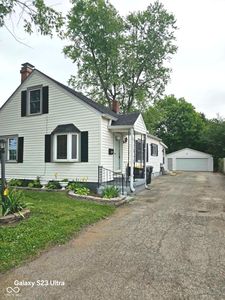
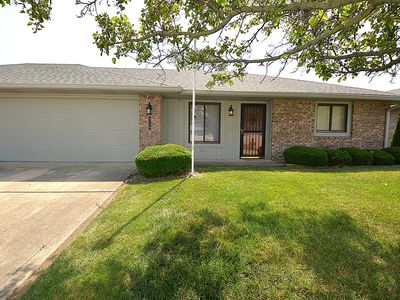
1105 W Tilmor DrMuncieIN47303
INVESTMENT ANALYSIS
Investment Verdict
Strong Cash Flow1105 W Tilmor Dr, Muncie, IN, 47303 in Muncie is a solid income-producing rental, 10.29% gross yield, $1,543/mo rent, $463/mo net cash flow on a $179,900 buy. DSCR 1.91 qualifies the property for Ziffy Mortgage's financing without personal income documentation. Five-year appreciation of $49,703 and $1,657/yr in principal reduction project a total cumulative return of $97,894.
| This Property | City Avg | |
|---|---|---|
| Gross Rental Yield | 10.3% | 6.8% |
| Monthly Cash Flow | $463 | $450 |
City averages based on Muncie market data in our database. Property projections are estimates.
DSCR Rental Loan Qualification
Qualifies using the property's rental income, not your personal income.
- ✓No W-2, pay stubs, or tax returns needed
- ✓Rental income qualifies you
- ✓Built for real estate investors
| Monthly Rental Income | $1,543 |
| Total Monthly Debt Service | $1,008 |
| DSCR Ratio | 1.53x |
Ziffy Mortgage: Your DSCR most likely meets our 1.0+ requirement, so you'll most probably qualify for our standard DSCR investment loan program. To pre-qualify, book time with your loan officer →
Estimates assume 6.0% rate / 30-yr fixed, 30% down, 1% tax, 0.5% insurance. Not a commitment to lend.
Single Family
Built in 1972
1,132 sqft lot
$N/A/sqft
No HOA
Neighborhood Data
Neighborhood data shown for ZIP Code: 47303, Muncie, IN area.
Housing Distribution
Housing Statistics
| Category | Value |
|---|---|
| Total HU (Housing Units) | 11,763 (100%) |
| Owner Occupied HU | 5,209 (44.3%) |
| Renter Occupied HU | 5,107 (43.4%) |
| Vacant Housing Units | 1,447 (12.3%) |
| Median Home Value | $126,994 |
| Average Home Value | $156,121 |
Housing Distribution
Address Breakdown
Residential
10,581
Single Family
9,579
Multi-Family
1,002
Businesses
776


Nearby investment properties with comparable rents
Nearby investment properties with comparable prices


Ziffy AI Summary
A quick, investor-focused snapshot highlighting income strength, yield potential.
| Key metrics | Value |
|---|---|
| Price | $399,900 |
| Est. Rent | $3,200/mo |
| ROI | 18% |
- Attractive rent-to-price ratio for income stability
- Good fit for DSCR financing with healthy coverage
Single Family
Built in 1972
1,132 sqft lot
$N/A/sqft
No HOA
Neighborhood Data
Neighborhood data shown for ZIP Code: 47303, Muncie, IN area.
Housing Distribution
Housing Statistics
| Category | Value |
|---|---|
| Total HU (Housing Units) | 11,763 (100%) |
| Owner Occupied HU | 5,209 (44.3%) |
| Renter Occupied HU | 5,107 (43.4%) |
| Vacant Housing Units | 1,447 (12.3%) |
| Median Home Value | $126,994 |
| Average Home Value | $156,121 |
Housing Distribution
Address Breakdown
Residential
10,581
Single Family
9,579
Multi-Family
1,002
Businesses
776
Nearby investment properties with comparable rents
Nearby investment properties with comparable prices
Listed by: Michael Lambert • Leading Home Realty
Mls Name: IRMLS
Mls Provider:
Mls ID: #202520317
Disclaimer: IDX information is provided exclusively for personal, non-commercial use, and may not be used for any purpose other than to identify prospective properties consumers may be interested in purchasing. Information is deemed reliable but not guaranteed.