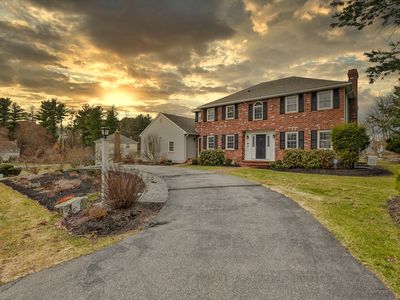
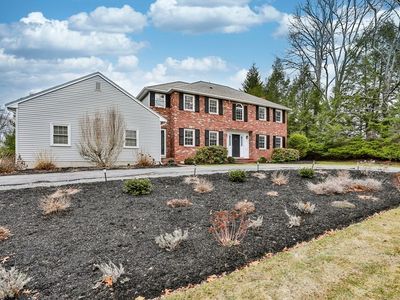
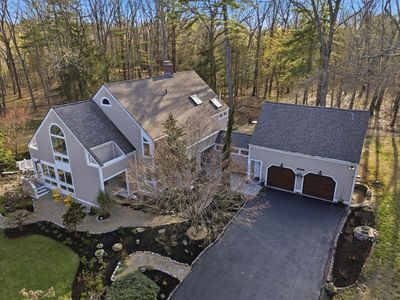
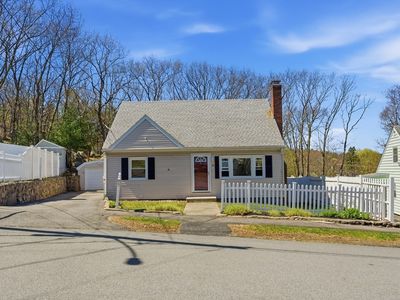
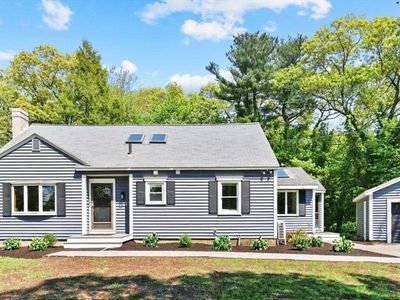
110 Quail Run RdNorth AndoverMA01845
INVESTMENT ANALYSIS
Investment Verdict
Appreciation PlayGlobal investors willing to prioritise equity over near-term yield will find 110 Quail Run Rd, North Andover, MA, 01845 in North Andover worth study. Rental yield 5.64%. The 5.64% gross yield is below cash-flow benchmarks at $1,189,000, but 5% annual appreciation, adding $328,499 over five years, frames this as a capital growth position. Rent of $5,587/mo partially offsets the $5,346/mo payment. Ziffy Mortgage finances appreciation-play properties (1.05 DSCR) for non-U.S. residents without domestic income documentation; a 30–35% down payment maximises coverage. Total projected return: $328,757.
| This Property | City Avg | |
|---|---|---|
| Gross Rental Yield | 5.6% | 5.5% |
| Monthly Cash Flow | $(1,907) | $350 |
City averages based on North Andover market data in our database. Property projections are estimates.
DSCR Rental Loan Qualification
Qualifies using the property's rental income, not your personal income.
- ✓No W-2, pay stubs, or tax returns needed
- ✓Rental income qualifies you
- ✓Built for real estate investors
| Monthly Rental Income | $5,587 |
| Total Monthly Debt Service | $7,021 |
| DSCR Ratio | 0.80x |
Ziffy Mortgage typically prefers a DSCR of 1.0+, but in some cases you may qualify with a DSCR below 1. To explore if this deal qualifies for an investment mortgage, book time with your loan officer →
Estimates assume 6.0% rate / 30-yr fixed, 30% down, 1% tax, 0.5% insurance. Not a commitment to lend.
Single Family
Built in 1981
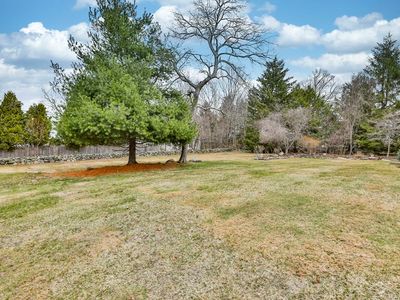
0.58 Acres lot
$N/A/sqft
No HOA
Neighborhood Data
Neighborhood data shown for ZIP Code: 01845, North Andover, MA area.
Housing Distribution
Housing Statistics
| Category | Value |
|---|---|
| Total HU (Housing Units) | 12,358 (100%) |
| Owner Occupied HU | 8,307 (67.2%) |
| Renter Occupied HU | 3,501 (28.3%) |
| Vacant Housing Units | 550 ( 4.5%) |
| Median Home Value | $773,736 |
| Average Home Value | $807,808 |
Housing Distribution
Address Breakdown
Residential
12,197
Single Family
8,665
Multi-Family
3,532
Businesses
1,177


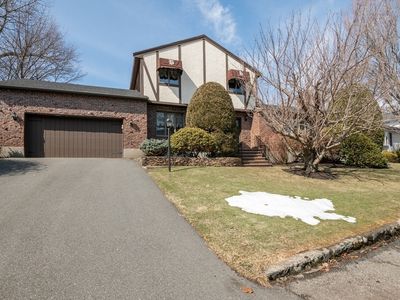
Nearby investment properties with comparable rents
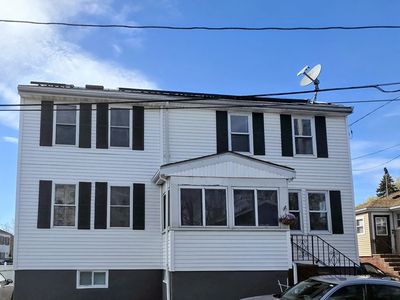
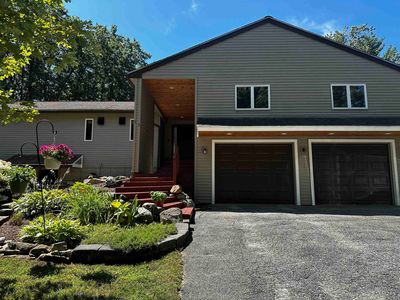
Nearby investment properties with comparable prices
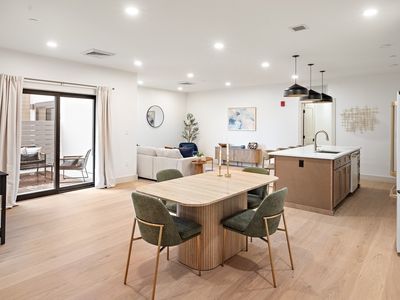

Ziffy AI Summary
A quick, investor-focused snapshot highlighting income strength, yield potential.
| Key metrics | Value |
|---|---|
| Price | $399,900 |
| Est. Rent | $3,200/mo |
| ROI | 18% |
- Attractive rent-to-price ratio for income stability
- Good fit for DSCR financing with healthy coverage
Single Family
Built in 1981
0.58 Acres lot
$N/A/sqft
No HOA
Neighborhood Data
Neighborhood data shown for ZIP Code: 01845, North Andover, MA area.
Housing Distribution
Housing Statistics
| Category | Value |
|---|---|
| Total HU (Housing Units) | 12,358 (100%) |
| Owner Occupied HU | 8,307 (67.2%) |
| Renter Occupied HU | 3,501 (28.3%) |
| Vacant Housing Units | 550 ( 4.5%) |
| Median Home Value | $773,736 |
| Average Home Value | $807,808 |
Housing Distribution
Address Breakdown
Residential
12,197
Single Family
8,665
Multi-Family
3,532
Businesses
1,177
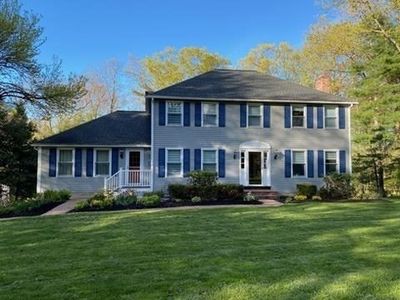
Nearby investment properties with comparable rents
Nearby investment properties with comparable prices
Listed by: N/A • N/A
Mls Name: MLS PIN
Mls ID: #73494369