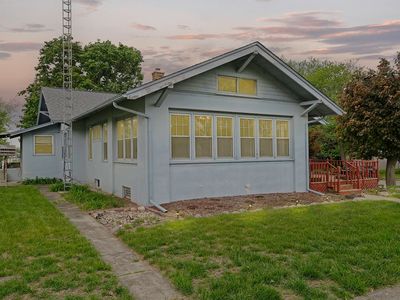
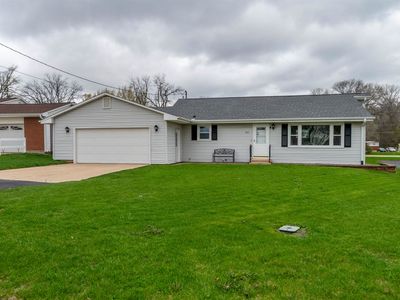
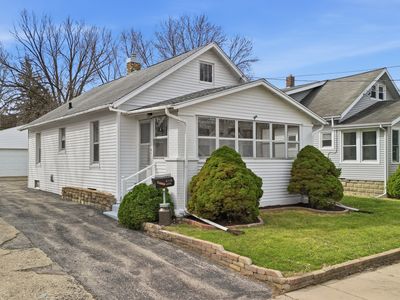
110 E Center StMount MorrisIL61054
INVESTMENT ANALYSIS
Investment Verdict
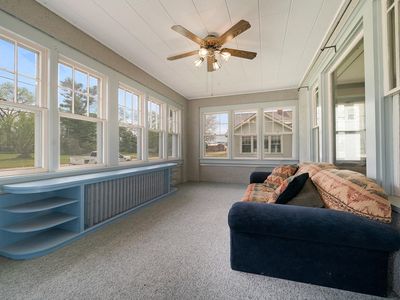
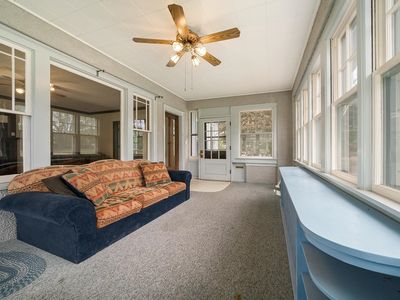
Strong Cash FlowFew Mount Morris rentals match the income profile of 110 E Center St, Mount Morris, IL, 61054. Listed at $160,000, gross rent is $2,034/mo and net cash flow is $905/mo, a 15.25% yield well above national averages. DSCR 2.83 means Ziffy Mortgage can approve your loan on the property's income alone, bypassing personal income verification. The 5% annual appreciation trend adds $44,205 by year five with $1,474/yr in annual principal reduction, projecting $119,584 in total cumulative return.
| This Property | City Avg | |
|---|---|---|
| Gross Rental Yield | 15.3% | 7.0% |
| Monthly Cash Flow | $905 | $150 |
City averages based on Mount Morris market data in our database. Property projections are estimates.
DSCR Rental Loan Qualification
Qualifies using the property's rental income, not your personal income.
- ✓No W-2, pay stubs, or tax returns needed
- ✓Rental income qualifies you
- ✓Built for real estate investors
| Monthly Rental Income | $2,034 |
| Total Monthly Debt Service | $1,065 |
| DSCR Ratio | 1.91x |
Ziffy Mortgage: Your DSCR most likely meets our 1.0+ requirement, so you'll most probably qualify for our standard DSCR investment loan program. To pre-qualify, book time with your loan officer →
Estimates assume 6.0% rate / 30-yr fixed, 30% down, 1% tax, 0.5% insurance. Not a commitment to lend.
Single Family
Built in 1938
8,712 sqft lot
$N/A/sqft
No HOA
Neighborhood Data
Neighborhood data shown for ZIP Code: 61054, Mount Morris, IL area.
Housing Distribution
Housing Statistics
| Category | Value |
|---|---|
| Total HU (Housing Units) | 1,903 (100%) |
| Owner Occupied HU | 1,164 (61.2%) |
| Renter Occupied HU | 529 (27.8%) |
| Vacant Housing Units | 210 (11.0%) |
| Median Home Value | $176,750 |
| Average Home Value | $237,317 |
Housing Distribution
Address Breakdown
Residential
1,697
Single Family
1,605
Multi-Family
92
Businesses
93


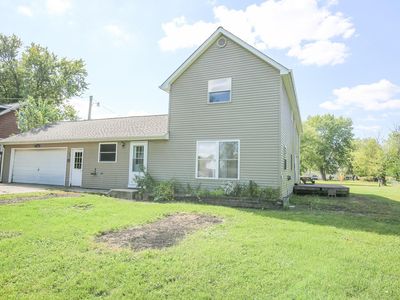
Nearby investment properties with comparable rents

Nearby investment properties with comparable prices

Ziffy AI Summary
A quick, investor-focused snapshot highlighting income strength, yield potential.
| Key metrics | Value |
|---|---|
| Price | $399,900 |
| Est. Rent | $3,200/mo |
| ROI | 18% |
- Attractive rent-to-price ratio for income stability
- Good fit for DSCR financing with healthy coverage
Single Family
Built in 1938
8,712 sqft lot
$N/A/sqft
No HOA
Neighborhood Data
Neighborhood data shown for ZIP Code: 61054, Mount Morris, IL area.
Housing Distribution
Housing Statistics
| Category | Value |
|---|---|
| Total HU (Housing Units) | 1,903 (100%) |
| Owner Occupied HU | 1,164 (61.2%) |
| Renter Occupied HU | 529 (27.8%) |
| Vacant Housing Units | 210 (11.0%) |
| Median Home Value | $176,750 |
| Average Home Value | $237,317 |
Housing Distribution
Address Breakdown
Residential
1,697
Single Family
1,605
Multi-Family
92
Businesses
93
Nearby investment properties with comparable rents
Nearby investment properties with comparable prices
Listed by: Rebecca Adams • Re/Max Of Rock Valley
Mls Name: NorthWest Illinois Alliance of REALTORS
Mls Provider:
Mls ID: #202502965
Disclaimer: IDX information is provided exclusively for personal, non-commercial use, and may not be used for any purpose other than to identify prospective properties consumers may be interested in purchasing. Information is deemed reliable but not guaranteed.