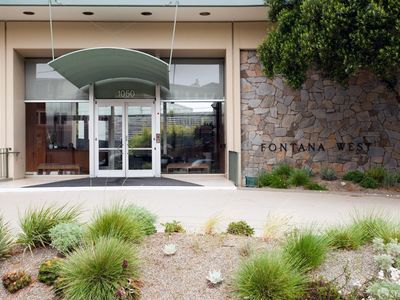
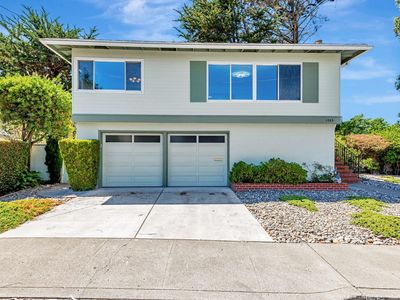
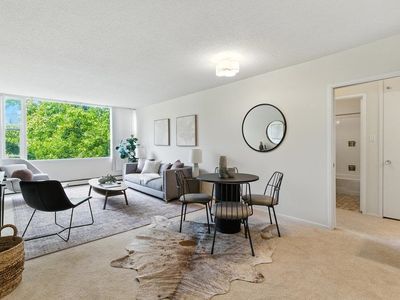
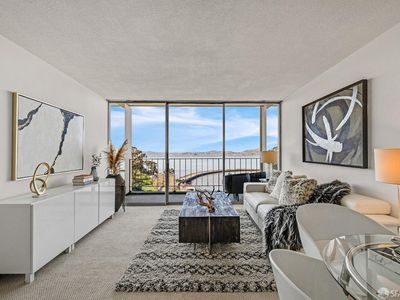
1050 N Point St APT 804San FranciscoCA94109
INVESTMENT ANALYSIS
Investment Verdict
Strong Cash FlowInvestors targeting immediate dollar income will find 1050 N Point St APT 804, San Francisco, CA, 94109 in San Francisco hard to pass up. The 10.92% gross yield on a $795,000 purchase results in $7,231/mo in rent and $945/mo in net cash, well above the spread required for Ziffy Mortgage's DSCR qualification (2.02). Annual cash flow of $11,342, five-year appreciation of $219,644, and $7,322/yr in equity build-up combine for a projected total cumulative return of $368,229.
| This Property | City Avg | |
|---|---|---|
| Gross Rental Yield | 10.9% | 4.5% |
| Monthly Cash Flow | $945 | $2,800 |
City averages based on San Francisco market data in our database. Property projections are estimates.
DSCR Rental Loan Qualification
Qualifies using the property's rental income, not your personal income.
- ✓No W-2, pay stubs, or tax returns needed
- ✓Rental income qualifies you
- ✓Built for real estate investors
| Monthly Rental Income | $7,231 |
| Total Monthly Debt Service | $5,970 |
| DSCR Ratio | 1.21x |
Ziffy Mortgage: Your DSCR most likely meets our 1.0+ requirement, so you'll most probably qualify for our standard DSCR investment loan program. To pre-qualify, book time with your loan officer →
Estimates assume 6.0% rate / 30-yr fixed, 30% down, 1% tax, 0.5% insurance. Not a commitment to lend.
Condo
Built in N/A
0.61 Acres lot
$N/A/sqft
$1,368 monthly HOA
Neighborhood Data
Neighborhood data shown for ZIP Code: 94109, San Francisco, CA area.
Housing Distribution
Housing Statistics
| Category | Value |
|---|---|
| Total HU (Housing Units) | 37,315 (100%) |
| Owner Occupied HU | 5,024 (13.5%) |
| Renter Occupied HU | 27,401 (73.4%) |
| Vacant Housing Units | 4,890 (13.1%) |
| Median Home Value | $1,405,903 |
| Average Home Value | $1,454,398 |
Housing Distribution
Address Breakdown
Residential
35,916
Single Family
3,046
Multi-Family
32,870
Businesses
1,940


Nearby investment properties with comparable rents
Nearby investment properties with comparable prices


Ziffy AI Summary
A quick, investor-focused snapshot highlighting income strength, yield potential.
| Key metrics | Value |
|---|---|
| Price | $399,900 |
| Est. Rent | $3,200/mo |
| ROI | 18% |
- Attractive rent-to-price ratio for income stability
- Good fit for DSCR financing with healthy coverage
Condo
Built in N/A
0.61 Acres lot
$N/A/sqft
$1,368 monthly HOA
Neighborhood Data
Neighborhood data shown for ZIP Code: 94109, San Francisco, CA area.
Housing Distribution
Housing Statistics
| Category | Value |
|---|---|
| Total HU (Housing Units) | 37,315 (100%) |
| Owner Occupied HU | 5,024 (13.5%) |
| Renter Occupied HU | 27,401 (73.4%) |
| Vacant Housing Units | 4,890 (13.1%) |
| Median Home Value | $1,405,903 |
| Average Home Value | $1,454,398 |
Housing Distribution
Address Breakdown
Residential
35,916
Single Family
3,046
Multi-Family
32,870
Businesses
1,940
Nearby investment properties with comparable rents
Nearby investment properties with comparable prices