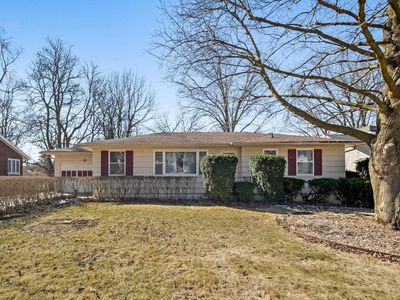
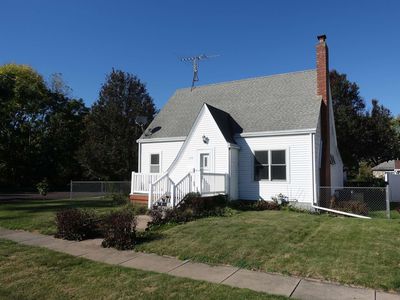
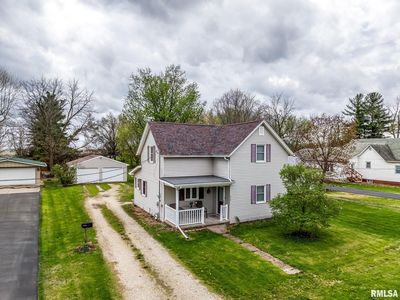
1033 E Boston AveMonmouthIL61462
INVESTMENT ANALYSIS
Investment Verdict
Strong Cash FlowStrong cash flow defines 1033 E Boston Ave, Monmouth, IL, 61462 in Monmouth: $1,778/mo in rent, $730/mo net, 14.73% gross yield, all on a $144,900 acquisition. The 2.73 coverage ratio comfortably clears Ziffy Mortgage's threshold, enabling foreign-national buyers to close without U.S. credit documentation. Over five years, 5% appreciation adds $40,033 in value, and $1,335/yr in principal paydown steadily builds equity. Projected total cumulative return: $102,589.
| This Property | City Avg | |
|---|---|---|
| Gross Rental Yield | 14.7% | 7.0% |
| Monthly Cash Flow | $730 | $900 |
City averages based on Monmouth market data in our database. Property projections are estimates.
DSCR Rental Loan Qualification
Qualifies using the property's rental income, not your personal income.
- ✓No W-2, pay stubs, or tax returns needed
- ✓Rental income qualifies you
- ✓Built for real estate investors
| Monthly Rental Income | $1,778 |
| Total Monthly Debt Service | $991 |
| DSCR Ratio | 1.80x |
Ziffy Mortgage: Your DSCR most likely meets our 1.0+ requirement, so you'll most probably qualify for our standard DSCR investment loan program. To pre-qualify, book time with your loan officer →
Estimates assume 6.0% rate / 30-yr fixed, 30% down, 1% tax, 0.5% insurance. Not a commitment to lend.
Single Family
Built in 1955
0.31 Acres lot
$N/A/sqft
No HOA
Neighborhood Data
Neighborhood data shown for ZIP Code: 61462, Monmouth, IL area.
Housing Distribution
Housing Statistics
| Category | Value |
|---|---|
| Total HU (Housing Units) | 4,818 (100%) |
| Owner Occupied HU | 3,039 (63.1%) |
| Renter Occupied HU | 1,128 (23.4%) |
| Vacant Housing Units | 651 (13.5%) |
| Median Home Value | $112,163 |
| Average Home Value | $161,049 |
Housing Distribution
Address Breakdown
Residential
4,397
Single Family
4,029
Multi-Family
368
Businesses
399


Nearby investment properties with comparable rents
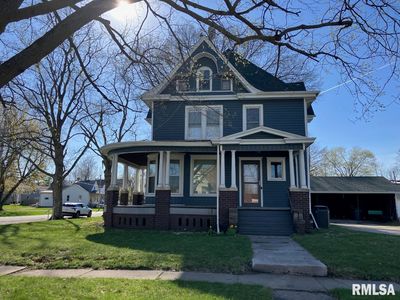
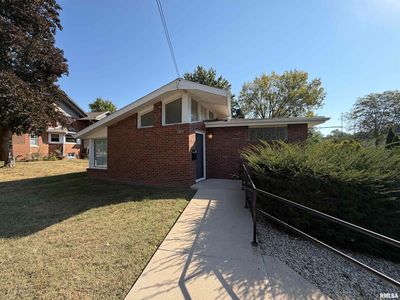
Nearby investment properties with comparable prices

Ziffy AI Summary
A quick, investor-focused snapshot highlighting income strength, yield potential.
| Key metrics | Value |
|---|---|
| Price | $399,900 |
| Est. Rent | $3,200/mo |
| ROI | 18% |
- Attractive rent-to-price ratio for income stability
- Good fit for DSCR financing with healthy coverage
Single Family
Built in 1955
0.31 Acres lot
$N/A/sqft
No HOA
Neighborhood Data
Neighborhood data shown for ZIP Code: 61462, Monmouth, IL area.
Housing Distribution
Housing Statistics
| Category | Value |
|---|---|
| Total HU (Housing Units) | 4,818 (100%) |
| Owner Occupied HU | 3,039 (63.1%) |
| Renter Occupied HU | 1,128 (23.4%) |
| Vacant Housing Units | 651 (13.5%) |
| Median Home Value | $112,163 |
| Average Home Value | $161,049 |
Housing Distribution
Address Breakdown
Residential
4,397
Single Family
4,029
Multi-Family
368
Businesses
399
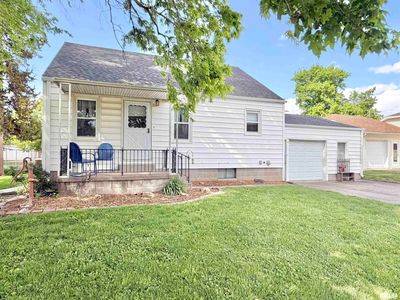
Nearby investment properties with comparable rents
Nearby investment properties with comparable prices
Listed by: Robin Bell • Currents and Keys Realty
Mls Name: RMLS Alliance
Mls Provider:
Mls ID: #QC4261439
Disclaimer: IDX information is provided exclusively for personal, non-commercial use, and may not be used for any purpose other than to identify prospective properties consumers may be interested in purchasing. Information is deemed reliable but not guaranteed.