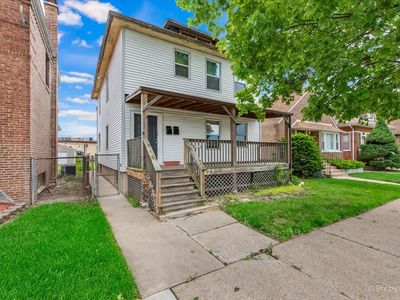
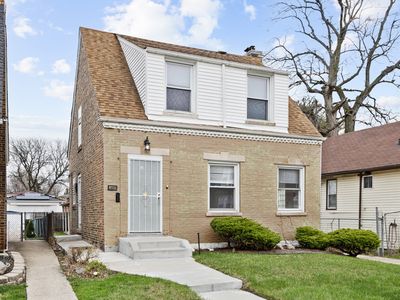
10321 S Green StChicagoIL60643
INVESTMENT ANALYSIS
Investment Verdict
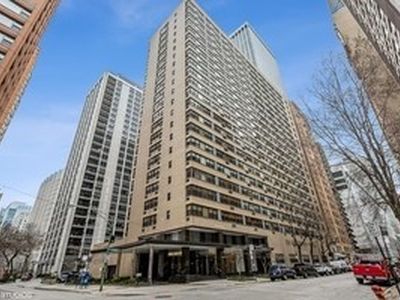
Strong Cash FlowDay-one income is the story at 10321 S Green St, Chicago, IL, 60643 in Chicago. Priced at $214,000, it generates $2,471/mo in gross rent and $986/mo in net monthly cash flow, a 13.85% yield that comfortably supports the 2.57 DSCR needed for Ziffy Mortgage's no-W2 DSCR mortgage. Projected annual cash flow: $11,838. Five-year appreciation: $59,124. Equity from principal paydown: $1,971/yr. Total projected cumulative return: $145,404.
| This Property | City Avg | |
|---|---|---|
| Gross Rental Yield | 13.9% | 6.1% |
| Monthly Cash Flow | $986 | $850 |
City averages based on Chicago market data in our database. Property projections are estimates.
DSCR Rental Loan Qualification
Qualifies using the property's rental income, not your personal income.
- ✓No W-2, pay stubs, or tax returns needed
- ✓Rental income qualifies you
- ✓Built for real estate investors
| Monthly Rental Income | $2,471 |
| Total Monthly Debt Service | $1,399 |
| DSCR Ratio | 1.77x |
Ziffy Mortgage: Your DSCR most likely meets our 1.0+ requirement, so you'll most probably qualify for our standard DSCR investment loan program. To pre-qualify, book time with your loan officer →
Estimates assume 6.0% rate / 30-yr fixed, 30% down, 1% tax, 0.5% insurance. Not a commitment to lend.
Multi Family
Built in N/A
3,750 sqft lot
$N/A/sqft
No HOA
Neighborhood Data
Neighborhood data shown for ZIP Code: 60643, Chicago, IL area.
Housing Distribution
Housing Statistics
| Category | Value |
|---|---|
| Total HU (Housing Units) | 19,398 (100%) |
| Owner Occupied HU | 13,014 (67.1%) |
| Renter Occupied HU | 4,834 (24.9%) |
| Vacant Housing Units | 1,550 ( 8.0%) |
| Median Home Value | $286,827 |
| Average Home Value | $334,678 |
Housing Distribution
Address Breakdown
Residential
18,424
Single Family
15,938
Multi-Family
2,486
Businesses
1,359


Nearby investment properties with comparable rents
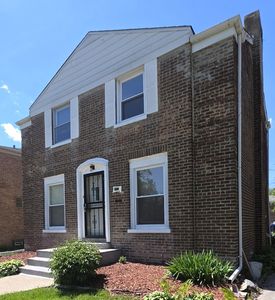
Nearby investment properties with comparable prices

Ziffy AI Summary
A quick, investor-focused snapshot highlighting income strength, yield potential.
| Key metrics | Value |
|---|---|
| Price | $399,900 |
| Est. Rent | $3,200/mo |
| ROI | 18% |
- Attractive rent-to-price ratio for income stability
- Good fit for DSCR financing with healthy coverage
Multi Family
Built in N/A
3,750 sqft lot
$N/A/sqft
No HOA
Neighborhood Data
Neighborhood data shown for ZIP Code: 60643, Chicago, IL area.
Housing Distribution
Housing Statistics
| Category | Value |
|---|---|
| Total HU (Housing Units) | 19,398 (100%) |
| Owner Occupied HU | 13,014 (67.1%) |
| Renter Occupied HU | 4,834 (24.9%) |
| Vacant Housing Units | 1,550 ( 8.0%) |
| Median Home Value | $286,827 |
| Average Home Value | $334,678 |
Housing Distribution
Address Breakdown
Residential
18,424
Single Family
15,938
Multi-Family
2,486
Businesses
1,359
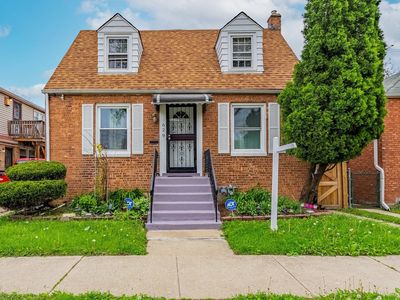
Nearby investment properties with comparable rents
Nearby investment properties with comparable prices
Listed by: Yuliya Onyshchuk • Marblestone Property Group LLC
Mls Name: MRED as distributed by MLS GRID
Mls Provider:
Mls ID: #12378294
Disclaimer: Based on information submitted to the MLS GRID as of 2025. All data is obtained from various sources and may not have been verified by broker or MLS GRID. Supplied Open House Information is subject to change without notice. All information should be independently reviewed and verified for accuracy. Properties may or may not be listed by the office/agent presenting the information. Some IDX listings have been excluded from this website. [Click here for more information](/mls-disclaimers/#17)