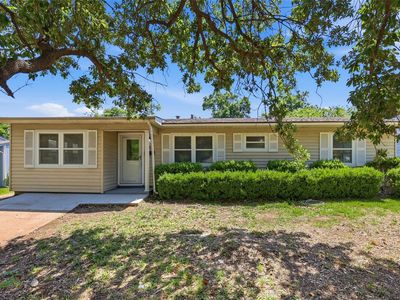
1021 Tracy LnLancasterTX75134

INVESTMENT ANALYSIS
Investment Verdict
Strong Cash FlowStrong cash flow defines 1021 Tracy Ln, Lancaster, TX, 75134 in Lancaster: $2,222/mo in rent, $568/mo net, 11.47% gross yield, all on a $232,600 acquisition. The 2.12 coverage ratio comfortably clears Ziffy Mortgage's threshold, enabling foreign-national buyers to close without U.S. credit documentation. Over five years, 5% appreciation adds $64,263 in value, and $2,142/yr in principal paydown steadily builds equity. Projected total cumulative return: $125,712.
| This Property | National Avg | |
|---|---|---|
| Gross Rental Yield | 11.5% | 6.2% |
| Monthly Cash Flow | $568 | $180 |
National averages based on 2024–2025 U.S. residential rental market data. Content is user-generated and unverified.
DSCR Rental Loan Qualification
Qualifies using the property's rental income, not your personal income.
- ✓No W-2, pay stubs, or tax returns needed
- ✓Rental income qualifies you
- ✓Built for real estate investors
| Monthly Rental Income | $2,222 |
| Total Monthly Debt Service | $1,562 |
| DSCR Ratio | 1.42x |
Ziffy Mortgage: Your DSCR most likely meets our 1.0+ requirement, so you'll most probably qualify for our standard DSCR investment loan program. To pre-qualify, book time with your loan officer →
Estimates assume 6.0% rate / 30-yr fixed, 30% down, 1% tax, 0.5% insurance. Not a commitment to lend.
Single Family
Built in 1977
7,200 sqft lot
$N/A/sqft
No HOA
Neighborhood Data
Neighborhood data shown for ZIP Code: 75134, Lancaster, TX area.
Housing Distribution
Housing Statistics
| Category | Value |
|---|---|
| Total HU (Housing Units) | 7,830 (100%) |
| Owner Occupied HU | 4,566 (58.3%) |
| Renter Occupied HU | 2,789 (35.6%) |
| Vacant Housing Units | 475 ( 6.1%) |
| Median Home Value | $275,768 |
| Average Home Value | $313,462 |
Housing Distribution
Address Breakdown
Residential
7,055
Single Family
6,308
Multi-Family
747
Businesses
266


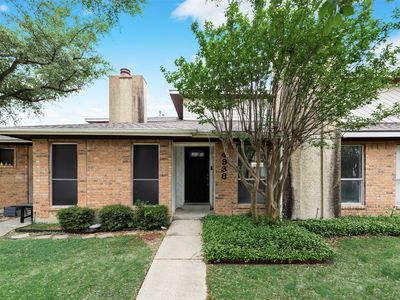
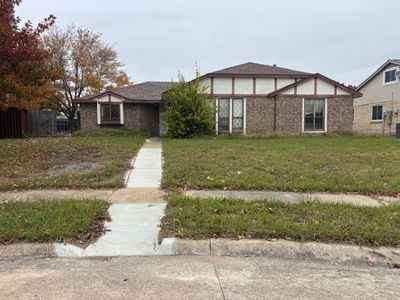
Nearby investment properties with comparable rents
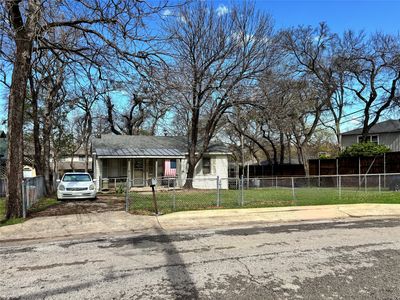
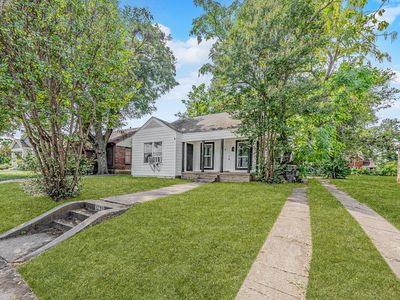
Nearby investment properties with comparable prices


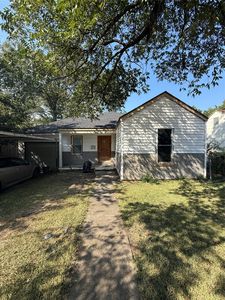
Ziffy AI Summary
A quick, investor-focused snapshot highlighting income strength, yield potential.
| Key metrics | Value |
|---|---|
| Price | $399,900 |
| Est. Rent | $3,200/mo |
| ROI | 18% |
- Attractive rent-to-price ratio for income stability
- Good fit for DSCR financing with healthy coverage
Single Family
Built in 1977
7,200 sqft lot
$N/A/sqft
No HOA
Neighborhood Data
Neighborhood data shown for ZIP Code: 75134, Lancaster, TX area.
Housing Distribution
Housing Statistics
| Category | Value |
|---|---|
| Total HU (Housing Units) | 7,830 (100%) |
| Owner Occupied HU | 4,566 (58.3%) |
| Renter Occupied HU | 2,789 (35.6%) |
| Vacant Housing Units | 475 ( 6.1%) |
| Median Home Value | $275,768 |
| Average Home Value | $313,462 |
Housing Distribution
Address Breakdown
Residential
7,055
Single Family
6,308
Multi-Family
747
Businesses
266
Nearby investment properties with comparable rents
Nearby investment properties with comparable prices