


Editorial Integrity
Making sound real estate investment decisions begins with reliable, data-driven insights. At Ziffy.ai, we offer an AI-native real estate investing, proprietary data-driven trend analysis, investment mortgage programs like DSCR loans, and a network of over 500 investor-friendly real estate agents to deliver the expertise needed for informed decisions. Our content is crafted by experienced real estate professionals and backed by real-time market data, ensuring you receive accurate and actionable information. Through a rigorous editorial process, we strive to empower your investment journey with trustworthy and up-to-date guidance.
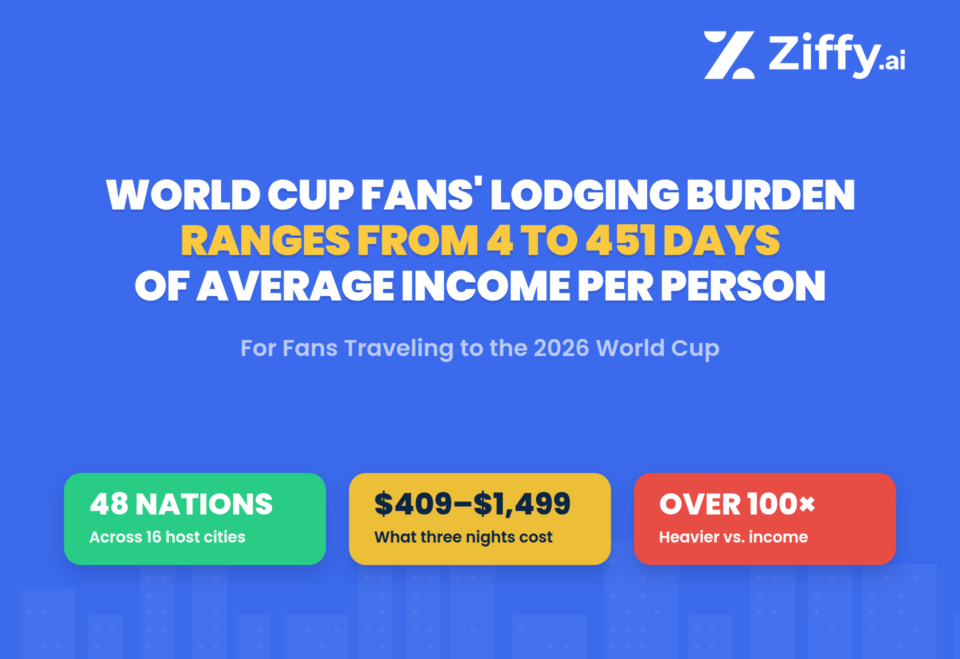
The 2026 World Cup is the first to send 48 national teams across three host countries. For traveling supporters, the group stage means three matches across the host cities their team is drawn into, sometimes the same city more than once, with the lodging bill shaped by the draw.
This analysis prices a standardized three-night group-stage lodging scenario for every qualified nation, then compares it with average income per person to show where the lodging burden is highest relative to income.
This is not an estimate of the full cost to follow a team. It is a standardized lodging-only index that prices one night in each host city where the team plays during the group stage. Each nation is assigned one lodging night in each host city where it plays a group-stage match, using average booked short-term-rental nightly rates.
Lodging figures use AirROI’s average booked short-term-rental nightly rate for each host city, not the higher asking rate for remaining available inventory.
Each nation is assigned the host cities of its three group-stage matches, with one lodging night counted per match to create a minimum-night, comparable scenario. Income is measured using the World Bank’s 2024 GNI per capita, Atlas method.
The result is a comparable “Fan Penalty” index for all 48 nations, expressed in total lodging dollars, days of average income per person, and share of one month’s average income.
Note: The headline finding is an affordability gap, not simply a travel-cost ranking. In dollars, the priciest group-stage draw is under four times the cheapest. Measured against average income per person, it is more than a hundred times heavier, and several of the cheapest trips in dollars are among the most punishing once set against local earnings.
Table of Contents
Morocco and France drew nearly the same group-stage lodging bill, but not the same affordability burden
Both route through New York/New Jersey and Boston and land within $13 of each other ($1,003 vs $990), yet that is about 95 days of average income per person in lodging for a Moroccan fan against 8 for a French fan, nearly twelve times heavier.
Some of the cheapest lodging draws in dollars are among the heaviest relative to income
Congo DR’s $828 draw is only the 12th-cheapest of 48 in dollars but the heaviest of all at 451 days of average income per person in lodging; South Africa’s $649, the third-cheapest in dollars sits mid-table at 39 days.
Across the 48 nations, the same three-night lodging scenario ranges from fewer than 4 days of average income per person to 451 days
Six nations face more than 100 days; sixteen face fewer than ten; the median is about 17.
Fans of African nations carry the heaviest burden as a bloc, a median of about 117 days of average income per person
That is roughly fourteen times the European median of about 8 days.
Seattle and Kansas City have the highest average booked nightly rates among U.S. host cities, at $473 and $454
Mexico City is the cheapest host city anywhere at $107; Vancouver is the priciest at $554.
The Affordability Gap: What Following a Team Costs Relative to Income
Every nation plays exactly three group-stage matches, so the lodging bill comes down to which cities a team was drawn into. In dollars, that produces a fairly narrow band. Measured against average income per person, the band widens sharply, and the order of who has it hardest turns over almost completely.
1. The same three-night lodging scenario ranges from fewer than 4 days of average income to 451, a spread the dollar figure hides
In absolute terms, the group-stage trip is bounded. The cheapest draw, Mexico’s, totals $409 for three nights; the most expensive, Egypt’s, totals $1,499. That is a range of under four-fold, and on its own it reads like an ordinary travel-cost story, some cities are pricier than others.
The picture changes once each figure is set against average income per person. The same three-night scenario equals 3.7 days of average income for a Norwegian fan but 451 days for a fan from Congo DR, more than a hundred times heavier despite the same one-night-per-match assumption.
The median nation sits at about 17 days. Six nations face more than 100 days of average income per person for three nights of stadium-area lodging alone, before flights, tickets, or food; sixteen face fewer than ten.
The dollar range and the income range describe the same 48 trips, but they tell opposite stories about who can afford to go.
Throughout this analysis, the lodging figure is the sum of the booked nightly rate in each of a nation’s three host cities, counted as one night per match. It is a deliberate floor: a fan attending all three group games needs at least these nights, and most will need more.
Because GNI per capita is an average, not a median wage or household-income measure, it may understate the burden for fans earning below their country’s average.
2. Morocco and France drew nearly the same itinerary at nearly the same price, but Morocco’s burden is almost twelve times heavier relative to income
Morocco and France offer the cleanest illustration of the gap because their trips are almost interchangeable. Both were drawn through New York/New Jersey and Boston, and their third cities, Atlanta for Morocco, Philadelphia for France, carry nearly identical booked rates. Their three-night totals land within $13 of one another.
Against income, the two diverge sharply. For a French fan, $990 is about 8 days of average income per person and roughly a quarter of an average month.
For a Moroccan fan, $1,003 is about 95 days, more than three months of average income per person, and nearly twelve times the French figure for effectively similar routes: both include New York/New Jersey and Boston, with similarly priced third stops in Atlanta and Philadelphia.
The dollar price describes the cities both sets of fans visit; the days-of-income figure describes the distance between them.
Morocco | France | |
|---|---|---|
Group-stage host cities | New York/New Jersey, Boston, Atlanta | New York/New Jersey, Philadelphia, Boston |
Lodging, 3 nights | $1,003 | $990 |
Days of average annual GNI per capita | 95.3 | 8 |
Share of monthly income | 313% | 26% |
3. The cheapest draws in dollars are among the heaviest once measured against income.
Ranking the 48 nations by dollars and by income burden produces nearly opposite orders at the edges. Congo DR drew the 12th-cheapest itinerary of any nation at $828, yet it carries the heaviest burden of all, 451 days of average income per person.
Senegal’s $817 draw is the 11th-cheapest in dollars but the third-heaviest in income terms. South Africa, with the third-cheapest draw in dollars at $649, still lands at 39 days.
At the other end, Norway and Switzerland drew trips that cost as much or more in dollars, $991 and $1,084, but represent a much smaller share of average income per person at 3.7 and 4.2 days.
The inversion is the core of the analysis: a low sticker price does not mean an affordable trip, because affordability is set by the fan’s income, not the city’s nightly rate.
Nation | Lodging, 3 nights | Rank by dollars (1 = cheapest) | Days of average GNI per capita | Rank by burden (1 = heaviest) |
|---|---|---|---|---|
Congo DR | $828 | 12 / 48 | 451.2 | 1 / 48 |
Senegal | $817 | 11 / 48 | 177.5 | 3 / 48 |
South Africa | $649 | 3 / 48 | 38.8 | 19 / 48 |
Switzerland | $1,084 | 35 / 48 | 4.2 | 47 / 48 |
Norway | $991 | 21 / 48 | 3.7 | 48 / 48 |
Note: Rank by dollars orders all 48 nations from cheapest to most expensive lodging. Rank by burden orders nations from heaviest to lightest days of average income per person.

Debjit Saha
Co-Founder and CTO | Ziffy.ai
The dollar cost tells you where the matches are. The income burden tells you who feels it most. Once lodging prices are measured against average income per person, the World Cup affordability ranking changes completely.
All 48 Nations Ranked by Lodging Cost Relative to Average Income
The full ranking orders every qualified nation by days of average income per person required for three nights’ lodging, heaviest first. It shows which fan bases face the highest lodging burden once the same three-night scenario is measured against average income per person.
4. Ranked by income burden, the heaviest draws fall on lower-income nations across Africa, the Caribbean, and Central Asia; the lightest fall mostly on Western Europe and North America.
The top of the table is dominated by African and lower-income nations: Congo DR, Haiti, Senegal, Egypt, Ghana, and Côte d’Ivoire all exceed 100 days of average income per person.
The bottom is occupied by the wealthiest footballing nations, Norway, Switzerland, the United States, Germany, and Sweden, none above six days. Dollar cost moves through the table almost at random by comparison: nations with sub-$900 trips appear near the top, and nations with trips above $1,300 appear near the bottom. The ordering principle is income, not price.
Note: Share of monthly income” is calculated as lodging cost divided by one-twelfth of annual GNI per capita. Values above 100% mean the three-night lodging bill exceeds one month of average income per person.
From Under 4 Days of Average Income to More Than 451
The two ends of the ranking describe the same three-night lodging scenario in entirely different human terms. The tables below add each nation’s three host cities, so the itinerary behind the figure is visible, the extremes are produced by the draw and the income together, not by unusually cheap or expensive cities.
5. Six nations face lodging burdens above 100 days of average income, led by Congo DR at 451 days, more than a year of average income per person
For these six nations, three nights of stadium-area lodging alone exceeds three months of average income per person, and in Congo DR’s case exceeds a full year.
None of the six drew an unusually expensive itinerary in dollars, Congo DR’s $828 and Senegal’s $817 are below the 48-nation average, which is precisely why the burden is a function of income rather than price. Egypt is the one heavy-burden nation that also drew an expensive trip in dollars, at $1,499.
Nation | Host cities | Lodging, 3 nights (USD) | Days | Monthly income share |
|---|---|---|---|---|
Congo DR | Houston, Guadalajara, Atlanta | $828 | 451.2 | 1483% |
Haiti | Boston, Philadelphia, Atlanta | $1,073 | 222.5 | 732% |
Senegal | New York/New Jersey, New York/New Jersey, Toronto | $817 | 177.5 | 584% |
Egypt | Seattle, Vancouver, Seattle | $1,499 | 155.9 | 512% |
Ghana | Toronto, Boston, Philadelphia | $958 | 151.3 | 498% |
Côte d’Ivoire | Philadelphia, Toronto, Philadelphia | $957 | 138.1 | 454% |
Note: “Days” means days of average income per person required for three nights’ lodging. “Monthly income share” is lodging cost divided by one-twelfth of annual GNI per capita. Income source: World Bank 2024 GNI per capita, Atlas method.
6. Sixteen nations face fewer than ten days of average income; Norway has the lightest burden, at under four days
At the opposite end, the same three-night lodging scenario is the equivalent of a few days of average income per person.
The lightest burdens fall on the highest-income nations regardless of what their trips cost in dollars: Norway’s $991 and Switzerland’s $1,084 are mid-pack and high in absolute terms, yet both sit under 4.3 days because average income per person is high.
The United States, the most prominent co-host, lands among the lightest at 4.7 days despite a $1,080 draw.
Nation | Host cities | Lodging | Days | Monthly income share |
|---|---|---|---|---|
Norway | Boston, New York/New Jersey, Boston | $991 | 3.7 | 12% |
Switzerland | San Francisco Bay Area, Los Angeles, Vancouver | $1,084 | 4.2 | 14% |
USA | Los Angeles, Seattle, Los Angeles | $1,080 | 4.7 | 16% |
Germany | Houston, Toronto, New York/New Jersey | $800 | 5.3 | 17% |
Sweden | Monterrey, Houston, Dallas | $861 | 5.4 | 18% |
Korea Republic | Guadalajara, Guadalajara, Monterrey | $568 | 5.6 | 19% |

Amresh Singh
Founder and CEO | Ziffy.ai
The 2026 World Cup spans 48 teams and 48 economies. The same three nights of lodging can cost one fan base a few days of average income and another more than a year. That is the real affordability gap this analysis reveals.
What Lodging Costs Near Each Host Stadium
The nation-level Fan Penalty depends on the host cities a team draws, so the same figures can be turned around to ask a local question: what guests have booked near each host stadium during the tournament window?
The booked rates below are the same city-level figures that feed every nation’s total, ranked here from the most to least expensive host city.
7. Booked lodging across the 16 host cities runs from $107 a night in Mexico City to $554 in Vancouver
Vancouver is the most expensive host city for visitors at $554 a night booked, followed by Seattle at $473 and Kansas City at $454.
The three Mexican host cities anchor the bottom, Mexico City at $107, Monterrey at $177, and Guadalajara at $196, which is why nations routed through Mexico carry the lowest dollar totals.
Each city’s rate is what guests have already booked at, drawn from roughly 1,000 stadium-proximate listings, and applies to every nation that plays there.
Host city | Country | Avg. booked nightly rate (USD) | Group matches | Nations hosted |
|---|---|---|---|---|
Vancouver | Canada | $554 | 5 | 8 |
Seattle | USA | $473 | 4 | 7 |
Kansas City | USA | $454 | 4 | 7 |
Miami | USA | $438 | 4 | 7 |
Dallas | USA | $418 | 5 | 8 |
Atlanta | USA | $366 | 5 | 9 |
Boston | USA | $354 | 5 | 8 |
Philadelphia | USA | $353 | 5 | 9 |
Los Angeles | USA | $304 | 5 | 8 |
New York/New Jersey | USA | $283 | 5 | 9 |
Houston | USA | $266 | 5 | 9 |
Toronto | Canada | $251 | 5 | 9 |
San Francisco Bay Area | USA | $227 | 5 | 8 |
Guadalajara | Mexico | $196 | 4 | 7 |
Monterrey | Mexico | $177 | 3 | 5 |
Mexico City | Mexico | $107 | 3 | 5 |
Note- “Nations hosted” counts the distinct teams playing at least one group-stage match in the city. Rates are city-level averages from AirROI’s booked short-term-rental data, not hotel rates or asking rates for remaining available inventory, and are applied uniformly to each match hosted in that city. Rates may exclude taxes, platform fees, cleaning fees, and minimum-stay requirements.
8. Among the eleven U.S. host cities, Seattle and Kansas City have the highest average booked rates; the San Francisco Bay Area and Houston have the lowest
For US-based coverage, the host-city ranking gives every market a local figure. Seattle ($473) and Kansas City ($454) are the most expensive US host cities to stay near, followed by Miami ($438) and Dallas ($418).
At the other end, the San Francisco Bay Area ($227), Houston ($266), and New York/New Jersey ($283) are the most affordable US host cities to stay near, a reminder that proximity to the largest metros does not translate into the highest booked rates.
Because each city hosts four to five group-stage matches drawing seven to nine different nations, the local angle in each market is not a single fan base but a rotating cast.
Kansas City is the sharpest local story: it pairs the second-highest U.S. booked lodging rate with group-stage matches involving Algeria, Ecuador, Curaçao, Tunisia, the Netherlands, Argentina, and Austria, including several fan bases that rank high on the income-burden index.
The Regional Divide and the Three Co-Hosts
Grouping the 48 nations by confederation makes the income pattern unmistakable, and isolating the three host nations shows how home-city draws and national income interact.
9. Fans of African nations carry the heaviest burden as a bloc, with a median of about 117 days, roughly fourteen times Europe’s 8.1-day median
Africa’s ten qualified nations post a median burden of about 117 days of average income per person, by far the highest of any confederation and driven by a cluster of lower-income nations near the top of the overall ranking.
South America follows at about 39 days. Europe’s sixteen qualified nations sit at the bottom, with a median of 8.1 days, roughly one-fourteenth of Africa’s median. Asia sits around 11 days, while Oceania, represented by New Zealand, is 10.8 days.
The grouping is descriptive: it reflects the income levels of the nations that qualified, not anything about the draw itself, which assigns cities without regard to a team’s origin.
Confederation | Nations | Median days of income | Lightest burden, days | Heaviest burden, days |
|---|---|---|---|---|
Africa (CAF) | 10 | 116.7 | 38.8 | 451.2 |
South America (CONMEBOL) | 6 | 39 | 18.1 | 61.9 |
North & Central America (CONCACAF) | 6 | 13.8 | 4.7 | 222.5 |
Asia (AFC) | 9 | 11 | 5.6 | 89.3 |
Oceania (OFC) | 1 | 10.8 | 10.8 | 10.8 |
Europe (UEFA) | 16 | 8.1 | 3.7 | 42.6 |
Note- Median, lightest, and heaviest days of average income per person among each confederation’s qualified nations.
10. Among the three co-hosts, Mexico’s fans get the cheapest lodging draw in dollars but not in income; U.S. and Canadian fans are among the lightest-burdened in the field
The host nations show the inversion in miniature. Mexico’s fans face the cheapest draw of any nation in dollars, $409, the product of group matches falling in Mexico City and Guadalajara, two of the three lowest-priced host cities.
But against Mexican income that is still about 11.6 days, placing Mexico 28th of 48 when countries are ranked from heaviest to lightest burden, and heavier than the United States despite costing roughly a third as much in dollars.
United States fans, by contrast, face a $1,080 draw, more than two and a half times Mexico’s in dollars, yet only 4.7 days of average income per person, among the three lightest burdens in the entire field.
Canadian fans, routed through Toronto and the most expensive host city, Vancouver, carry the highest co-host dollar total at $1,359, which still amounts to 9.3 days of average income per person.
The three co-hosts, sharing a tournament and a continent, span nearly a threefold range in dollars and land in three different tiers of real-terms burden, the clearest possible demonstration that the dollar cost and the fan cost are not the same measure.
Methodology
This analysis combines three sources. Host-city lodging rates come from AirROI’s World Cup 2026 host-city analysis. The analysis uses AirROI’s average booked short-term-rental nightly rate for each host city over the June 11 to July 19 tournament window, rather than the higher asking rate for remaining available inventory.
In AirROI’s dataset, the booked rate reflects rates for short-term-rental nights that guests had already reserved, while the available rate reflects asking prices for unbooked inventory still listed for the tournament period. AirROI’s dataset is drawn from roughly 1,000 stadium-proximate listings per city. Sources were accessed June 10-12, 2026
These are city-level average booked short-term-rental rates, not asking rates, hotel rates, median prices, or match-date-specific quotes. Rates may exclude taxes, platform fees, cleaning fees, and minimum-stay requirements.
Match fixtures come from FIFA’s official 2026 group-stage schedule (72 matches), with each match dated to its host city’s local calendar date. Average income per person is measured using the World Bank’s 2024 GNI per capita, Atlas method, current US$.
In this analysis, “average income per person” refers to GNI per capita. It is not median income, disposable income, household income, wage income, or a measure of actual fan earnings.
Each nation is assigned the host cities of its three group-stage matches. Its lodging figure is the sum of the booked nightly rate in each of those cities, counted as one night per match.
Days of average income = lodging cost ÷ (annual GNI per capita ÷ 365). Share of monthly income = lodging cost ÷ (annual GNI per capita ÷ 12).
Percentages and totals are calculated on unrounded values, so the rounded figures shown in the tables may not reproduce them exactly.
The public ranking table is rounded for readability; unrounded fields are retained in the supporting data appendix.
Country names were standardized for readability. Some FIFA team names differ from World Bank country names. For example, Congo DR corresponds to World Bank’s “Congo, Dem. Rep.”; South Korea corresponds to FIFA’s “Korea Republic”; and Iran corresponds to FIFA’s “IR Iran.” England and Scotland use the United Kingdom’s World Bank GNI per capita value because the World Bank does not publish separate GNI per capita figures for those teams.
Income is measured in nominal terms; a purchasing-power-parity adjustment would lower the burden for lower-income nations and is discussed under Limitations.
Data Sources
1. AirROI World Cup 2026 Short-Term Rental Data
Metric used: average booked nightly rate in USD for each 2026 World Cup host city during the June 11-July 19, 2026 tournament window. Used to assign a city-level lodging rate to each group-stage match location. AirROI is credited as the source for host-city booked-rate data. Accessed June 10, 2026.
2. FIFA 2026 World Cup Match Schedule
Official group-stage fixtures, 72 matches, host cities, and dates used to assign each nation its three host cities.
3. World Bank GNI per Capita, Atlas Method, Current US$
Metric used: 2024 GNI per capita in current U.S. dollars. Used to calculate days of average income and share of one month’s average income for each qualified nation. Accessed June 10, 2026.
Definitions
| Term | Definition |
| 1. Three-night lodging scenario | A standardized lodging-only benchmark that assigns one lodging night to each nation’s three group-stage host cities. |
| 2. Group-stage lodging total | The sum of the booked short-term-rental nightly rates in the three host cities where a nation plays its group-stage matches. |
| 3. Booked short-term-rental nightly rate | AirROI’s average booked nightly rate for short-term rentals near each 2026 World Cup host stadium market. |
| 4. Days of average income | Group-stage lodging total ÷ (annual GNI per capita ÷ 365). |
| 5. Share of one month’s average income | Group-stage lodging total ÷ (annual GNI per capita ÷ 12). |
| 6. Average income per person | World Bank 2024 GNI per capita, Atlas method, current US$, used as a globally comparable income benchmark. |
| 7. Affordability gap | The ratio between the highest and lowest days-of-income burden across the 48 qualified nations. |
| 8. Fan Penalty lodging cost | The group-stage lodging total used in this report’s ranking tables. |
| 9. Lodging-only index | A comparison tool that measures lodging burden only. It does not estimate total fan travel cost. |
Ranking Calculations
The main ranking orders nations by days of average income required, from heaviest burden to lightest burden.
- Fan Penalty lodging cost – The sum of the booked nightly rate across a nation’s three group-stage host cities, counted as one night per match.
- Days of average income per person – Lodging divided by (annual GNI per capita divided by 365).
- Share of one month’s average income – Lodging divided by (annual GNI per capita divided by 12).
- Confederation medians – The median days-of-income figure among each confederation’s qualified nations; reported with the lightest and heaviest values to show the range.
Replicability
To replicate any nation’s calculation:
- Identify the nation’s three group-stage host cities from FIFA’s official 2026 World Cup group-stage schedule.
- Match each host city to AirROI’s average booked short-term-rental nightly rate for the June 11-July 19, 2026 tournament window.
- Add the three booked nightly rates to calculate the nation’s group-stage lodging total.
- Pull the nation’s 2024 GNI per capita from the World Bank, Atlas method, current US$.
- Calculate days of average income: group-stage lodging total ÷ (annual GNI per capita ÷ 365).
- Calculate share of one month’s average income: group-stage lodging total ÷ (annual GNI per capita ÷ 12).
Limitations
- The analysis covers lodging only. It excludes flights, match tickets, food, local transport and other travel costs. Rates may not include taxes, platform fees, cleaning fees, or minimum-stay requirements, so the figures should be read as a comparable lodging-rate index rather than final checkout prices.
- Booked rate is measured at the city level from a stadium-proximate sample and applied uniformly to every match in that city; it does not vary by individual match date and may not represent metro-wide conditions.
- GNI per capita is a national average. It does not capture income distribution within a country and is neither a median nor a wage; for the many fans who earn less than the national mean, the real burden is higher than the figures shown.
- Nominal income (Atlas method) is used rather than purchasing-power parity because the expense is incurred abroad in US and Canadian dollars, where a PPP adjustment does not apply; a PPP framing would lower the burden for lower-income nations.
- Confederation groupings and the co-host comparison are descriptive. They reflect the income levels of the nations that qualified and the cities they were drawn into; they do not imply that any region or draw causes the differences shown.
- This analysis describes the relationship between lodging cost and national income. It does not claim that income differences cause lodging-cost differences, nor that any individual fan faces these specific amounts; the figures represent a defined, comparable scenario, not a forecast.
- Rates are a snapshot of AirROI’s May 2026 dataset and may change as the tournament progresses, inventory sells through, or hosts adjust asking prices.
Notes
- This analysis does not factor in future changes to lodging prices, exchange rates, availability, or fan booking behavior. The figures are based on the rates and income data available at the time of analysis.
- This report uses a standardized three-night lodging scenario only. Actual fan trips may require more nights depending on travel schedules, match timing, minimum-stay rules, and personal itinerary choices.
- This report includes income-burden estimates for all 48 qualified nations. Additional cuts by host city, confederation, country, or custom visual format are available upon request at contact@ziffy.ai
About Ziffy
Ziffy is an AI-native real estate investment platform that helps investors discover, analyze, and finance U.S. real estate opportunities. The platform combines property search, investment analysis, and access to specialized financing solutions, including DSCR, fix-and-flip, and bridge loans. This research was produced by Ziffy’s data analytics team to provide transparency into housing, lodging, and affordability trends.