



Editorial Integrity
Making sound real estate investment decisions begins with reliable, data-driven insights. At Ziffy.ai, we offer an AI-native real estate investing, proprietary data-driven trend analysis, investment mortgage programs like DSCR loans, and a network of over 500 investor-friendly real estate agents to deliver the expertise needed for informed decisions. Our content is crafted by experienced real estate professionals and backed by real-time market data, ensuring you receive accurate and actionable information. Through a rigorous editorial process, we strive to empower your investment journey with trustworthy and up-to-date guidance.
Falling asking prices are not translating into lower mortgage payments across most U.S. housing markets.
Among 494 markets analyzed, 271 had a lower median asking price in August 2026 than a year earlier. But only 22 posted a decline large enough to offset the increase in the 30-year mortgage-rate benchmark from 6.26% to 6.95%.
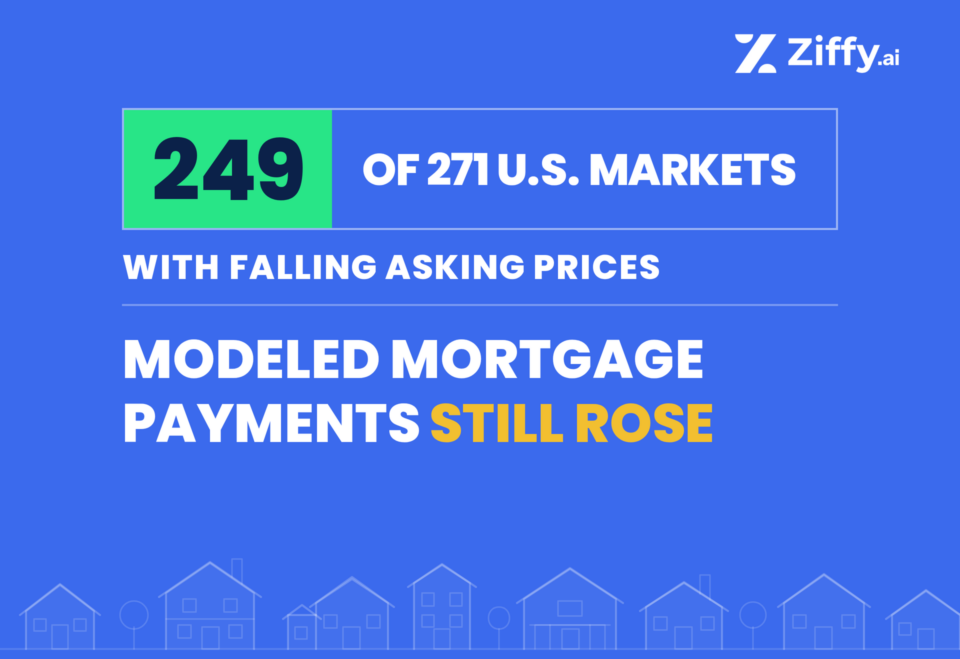
That means 249 of the 271 markets with falling asking prices 91.9% still produced a higher modeled monthly principal-and-interest payment.
At those two mortgage rates, the median asking price needs to fall by approximately 6.89% for the lower purchase price to fully offset the higher borrowing cost. Most markets did not come close: across the full 494-market sample, modeled P&I increased in 472 markets, or 95.5%.
The analysis uses August 2025 and August 2026 Realtor.com metro-level listing data and Freddie Mac’s comparable 30-year fixed mortgage-rate benchmarks to measure where lower asking prices have and have not translated into lower monthly financing costs.
Table of Contents
249 of 271 markets with lower asking prices still show higher modeled P&I
Only 22 of the 271 declining-price markets reached the -6.89% break-even. The other 249, or 91.9%, had lower median asking prices but higher modeled principal and interest than a year earlier.
Only two of the 50 largest markets reached payment break-even
Median asking prices declined in 42 of the 50 largest included markets. Austin and Memphis were the only two where the decline was large enough to leave modeled P&I at or below the year-ago level. Austin was also the only top-50 market to clear the same -6.89% threshold on both median asking price and median price per square foot.
The composition of listings explains part of the apparent price relief
Median listing size declined in 295 of the 494 markets. In 111 markets, the median asking price fell even though median price per square foot did not. Only four markets cleared the -6.89% threshold on both asking price and price per square foot.
Nine in Ten Markets With Falling Asking Prices Still Carry a Higher Mortgage Payment
A lower purchase price helps affordability only to the extent that it offsets the financing change. Consider a $400,000 listing financed with 20% down. The resulting $320,000 loan carries monthly principal and interest of about $1,972 at 6.26%. At 6.95%, principal and interest on the same loan rises to about $2,118.
That is roughly $146 more per month, a 7.4% increase. Holding the down-payment percentage and term constant, the asking price must decline about 6.89% for the smaller loan balance to fully offset the higher rate.
The 494-market sample falls into five reporting bands:
Asking-price outcome | Markets | Share | Median change in |
|---|---|---|---|
Fell 6.89% or more – payment at or below year ago | 22 | 4.5% | -$30/mo |
Fell 3.44% to 6.88% – at least half the gap closed | 87 | 17.6% | +$44/mo |
Fell less than 3.44% – less than half the gap closed | 162 | 32.8% | +$109/mo |
Unchanged – higher rate drives payment increase | 18 | 3.6% | +$141/mo |
Rose – higher price and higher rate | 205 | 41.5% | +$203/mo |
Total | 494 | 100.0% | – |
The first three rows contain all 271 markets with year-over-year asking-price declines. Only the first row reaches or passes the payment break-even. Looking at the full 494-market sample, modeled P&I is higher in 472 markets, or 95.5%.
The band boundaries are used for reporting, not to imply a sharp economic divide. For example, markets just above and below the -6.89% line can have nearly identical monthly payment outcomes. All classifications are therefore based on unrounded values, while the tables display rounded figures for readability.
Asking Price vs. Mortgage Rate Statistics [494 Markets Analyzed]
1. The Median Market-Level Increase in Modeled P&I Is $127 per Month
Across all 494 included markets, the median change in modeled principal and interest is +$127 per month. That calculation reflects each market’s actual August-to-August asking-price movement together with the increase in the benchmark mortgage rate from 6.26% to 6.95%. Because each market counts once, this is a median across markets rather than a population-weighted or listing-weighted national payment estimate.
2. 205 Markets Have Both a Higher Asking Price and a Higher Mortgage-Rate Benchmark
Median asking prices rose in 205 markets, representing 41.5% of the primary sample. Their median modeled P&I increase is about $203 per month. By comparison, the median increase is about $89 among markets where asking prices fell but not by enough to reach the break-even. This is the clearest group in which both components of the simplified payment model moved in the same direction: the modeled loan balance rose because the median asking price increased, while the mortgage-rate benchmark also increased.
3. Florida Recorded Lower Asking Prices in 23 of 26 Markets, but Modeled P&I Is Higher in All 26
Florida has 26 single-state markets in the primary sample. Twenty-three had lower median asking prices than a year earlier, yet none reached the -6.89% decline required for P&I break-even. Cape Coral-Fort Myers came closest: its median asking price declined 6.2%, leaving modeled P&I about $15 per month above the year-ago level. Tampa declined 6.0%, with modeled P&I about $19 higher. The gap is larger in Miami and Orlando. Miami’s median asking price fell 2.0%, but modeled P&I is about $129 higher. Orlando’s median asking price fell 1.9%, while modeled P&I is about $112 higher.
4. California Had Lower Asking Prices in 17 of 28 Markets, and None Reached Break-Even
Seventeen of California’s 28 included markets posted a year-over-year decline in median asking price. None reached -6.89%. San Diego declined 5.4%, but modeled P&I is still about $76 per month higher. San Francisco declined 5.0%, with modeled P&I about $97 higher. Los Angeles declined 4.5%, yet modeled P&I is about $136 higher. San Jose’s median asking price declined only 2.1%. Because of its much higher price level, its modeled P&I increase is approximately $349 per month, the largest increase among the 50 biggest markets in the study.
5. Texas Contains Five of the 22 Markets Where the Asking-Price Decline Fully Offsets the Rate Increase
Five Texas markets reached the P&I break-even: Austin, Brownsville-Harlingen, Laredo, Paris and Bay City. Across the state, 28 of 39 included markets had lower median asking prices than a year earlier. The largest Texas markets remain above break-even. Dallas declined 1.2%, leaving modeled P&I about $130 per month higher. Houston declined 1.6%, with modeled P&I about $101 higher. San Antonio declined 1.8%, with modeled P&I about $89 higher.
6. Six of the 50 Largest Markets Have Both Higher Asking Prices and the Higher Mortgage-Rate Benchmark
Among the 50 largest included markets, median asking prices increased in Chicago, Atlanta, Cincinnati, Virginia Beach, Richmond and Hartford. Their modeled P&I increases range from about $146 per month in Cincinnati to $262 in Virginia Beach. Chicago’s median asking price increased 5.4%, producing a modeled P&I increase of about $243 per month. Virginia Beach increased 5.1%; Hartford increased 2.4%. Nashville and Milwaukee form a separate group: their median asking prices were unchanged. Even without an asking-price increase, Nashville’s modeled P&I is about $197 per month higher because the mortgage benchmark is higher.
7. Nine Markets Are Within $10 per Month of the P&I Break-Even
The break-even classification should not be read as meaning every market above the line has experienced a material payment increase. Nine declining-price markets are less than $10 per month above their year-ago modeled P&I, and 17 are within $25.
Market | Asking-price change | Change in modeled P&I |
|---|---|---|
Show Low, AZ | -6.8% | +$2 |
Sanford, NC | -6.7% | +$4 |
Evansville, IN | -6.6% | +$4 |
Del Rio, TX | -6.6% | +$5 |
Sierra Vista-Douglas, AZ | -6.5% | +$6 |
Rocky Mount, NC | -6.4% | +$7 |
Bloomington, IN | -6.5% | +$8 |
Montgomery, AL | -6.4% | +$8 |
These markets sit very close to payment parity even though their exact unrounded values place them on the higher-payment side of the threshold.
8. San Jose, Boston and Virginia Beach Post the Largest Modeled P&I Increases Among the 50 Largest Markets
High-priced markets can show large dollar payment changes even when their asking-price movement is modest. San Jose leads the 50 largest markets with an increase of about $349 per month despite a 2.1% decline in median asking price. Boston follows at about +$266 with a 0.6% decline. Virginia Beach is third at about +$262, with its median asking price up 5.1%.
| Market | Asking-price change | Modeled P&I now | Change vs. year ago |
|---|---|---|---|
| San Jose, CA | -2.1% | $7,144 | +$349 |
| Boston, MA-NH | -0.6% | $4,210 | +$266 |
| Virginia Beach, VA-NC | +5.1% | $2,298 | +$262 |
| Chicago, IL-IN | +5.4% | $2,092 | +$243 |
| Hartford, CT | +2.4% | $2,436 | +$222 |
| New York, NY-NJ | -1.4% | $3,966 | +$219 |
The same rate change produces a larger dollar effect when it is applied to a larger mortgage balance, which is why expensive markets are prominent in this ranking.
9. A 19-Basis-Point Weekly Rate Move Reduced the Break-Even Count From 57 Markets to 22
Using the same August 2025 and August 2026 asking-price data, the required decline changes materially when the mortgage benchmark changes. At Freddie Mac’s 6.76% average on September 10, the P&I break-even requires an asking-price decline of about 5.07%, and 57 markets qualify.
At 6.95% one week later, the required decline becomes 6.89%, and only 22 markets qualify. The 19-basis-point increase therefore moves 35 markets from the break-even group to the higher-payment side without any change in the underlying housing-price observations.

Amresh Singh
Founder and CEO | Ziffy.ai
A small move in mortgage rates can meaningfully change how much lower an asking price has to be before the monthly financing benefit shows up. In this analysis, a 19-basis-point increase moved the break-even count from 57 markets to 22 even though the August listing data stayed exactly the same.
Where Asking-Price Declines Did and Didn’t Offset Higher Mortgage Rates
The five zones below sort the 494 markets by how their year-over-year median asking-price change compares with the -6.89% P&I break-even. Markets inside each zone are ordered by Realtor.com® household rank so larger markets appear first. The displayed number is the market’s rank within its zone, not its national household rank.
Zone 1: In 22 Markets, Asking-Price Declines Were Large Enough to Produce a Lower Mortgage Payment
These 22 markets are the only ones in the primary sample where the median asking-price decline was at least 6.89%. Under the standardized financing assumptions, modeled P&I is therefore at or below the year-ago amount.
Zone 2: In 87 Markets, Asking-Price Declines Closed at Least Half the Gap but Payments Still Rose
These markets declined by more than half of the -6.89% break-even amount but did not reach the full threshold. Their median modeled P&I increase is about $44 per month.
Zone 3: In 162 Markets, Asking-Price Declines Were Too Small to Offset Most of the Rate Increase
Zone 3 contains declining-price markets that did not even reach half of the -6.89% break-even. The group includes New York, Dallas, Houston, Miami, Boston and Seattle. Its median modeled P&I increase is about $109 per month.
Zone 4: In 18 Markets, Flat Asking Prices Left Buyers Fully Exposed to the Higher Rate
The median asking price is exactly unchanged in these 18 markets. With no decline in the modeled purchase price, the entire P&I difference comes from the higher mortgage-rate benchmark. The group’s median modeled increase is about $141 per month.
Zone 5: In 205 Markets, Buyers Faced Both Higher Asking Prices and a Higher Mortgage Rate
Zone 5 contains the 205 markets where median asking prices increased year over year. With the mortgage benchmark also higher, the median modeled P&I increase in this group is about $203 per month.
Lower Asking Prices Often Came With Smaller Homes
The median listing became smaller in 295 of the 494 markets, equal to 59.7% of the sample. That matters because a decline in the median asking price can reflect a different mix of homes on the market rather than the same homes becoming cheaper by the same percentage.
Among the 271 markets with a lower median asking price, 111 – 41.0% – did not also have a decline in median price per square foot. Across the entire 494-market sample, those 111 markets represent 22.5%.
The stricter threshold comparison reinforces the same point. Twenty-two markets clear the -6.89% break-even using median asking price, 12 clear it using median price per square foot, and only four clear it using both measures.
| Listing-Mix Check | Markets | Share of 494 Markets |
|---|---|---|
| Median listing size fell | 295 | 59.7% |
| Median asking price fell | 271 | 54.9% |
| Asking price fell, but price per sq. ft. did not | 111 | 22.5% |
| Asking price cleared the 6.89% break-even | 22 | 4.5% |
| Price per sq. ft. cleared the 6.89% break-even | 12 | 2.4% |
| Both measures cleared the 6.89% break-even | 4 | 0.8% |
The price-per-square-foot comparison is a robustness check, not a perfect constant-quality index. Median asking price and median price per square foot are separate medians calculated from the active listing pool, and price per square foot itself varies with property size and mix.
Indianapolis illustrates the composition issue. Its median asking price declined 5.3%, but the median listing size declined 12.1% and median price per square foot increased 4.4%. Austin shows a different pattern: its median asking price declined 9.8% and median price per square foot declined 8.0%. Austin is the only market among the 50 largest to clear the -6.89% threshold on both measures.
Why the Headline Analysis Uses 494 Markets Instead of All 925
The source file contains 925 metropolitan and micropolitan markets with observations for both August 2025 and August 2026. The headline sample is intentionally narrower.
The first screen removes 156 markets carrying a Realtor.com quality flag in either August. That leaves 769 unflagged markets. A second screen removes 275 additional markets with fewer than 200 active listings in either month, producing the 494-market primary sample.
The 200-listing minimum is a reporting-quality rule designed to reduce the influence of thin inventory on a market-level median. It is not a confidence interval and does not make the remaining markets statistically representative of all U.S. housing activity.
The broad direction of the results is similar across the three main universes, while the number of markets clearing break-even changes considerably:
| National Finding | Primary Analysis: 494 Markets | Unflagged: 769 Markets | Full Source: 925 Markets |
|---|---|---|---|
| Asking price fell | 271 (54.9%) | 397 (51.6%) | 492 (53.2%) |
| Asking price cleared 6.89% break-even | 22 (4.5%) | 55 (7.2%) | 134 (14.5%) |
| Price per sq. ft. cleared break-even | 12 | 28 | 62 |
| Both measures cleared break-even | 4 | 8 | 38 |
| Asking price fell, but modeled P&I remained higher | 249 | 342 | 358 |
Across these universes, the share of markets with lower asking prices stays close to one-half. What changes most is the number of extreme declines. In the unscreened 925-market source, 134 markets appear to clear the -6.89% threshold; in the primary sample, only 22 do.
That is consistent with the distribution of the quality flags. Every one of the 50 largest asking-price declines in the unscreened 925-market file carries a Realtor.com quality flag. Removing flagged observations therefore has its greatest effect exactly where the apparent asking-price declines are most extreme.
The Main Finding Persists Across Reasonable Active-Listing Cutoffs
The 200-listing threshold is still a judgment call, so the analysis was rerun with several alternative minimums while keeping the Realtor.com quality-flag screen unchanged.
| Minimum active listings in both Augusts | Included markets | Asking price fell | Cleared 6.89% break-even | Asking price fell, P&I rose | Share of falling-price markets where P&I rose |
|---|---|---|---|---|---|
| No minimum -unflagged markets only | 769 | 397 | 55 | 342 | 86.1% |
| 100 | 648 | 342 | 42 | 300 | 87.7% |
| 150 | 562 | 310 | 33 | 277 | 89.4% |
| 200 – primary analysis | 494 | 271 | 22 | 249 | 91.9% |
| 250 | 438 | 256 | 21 | 235 | 91.8% |
| 300 | 397 | 237 | 19 | 218 | 92.0% |
The exact percentage varies with the inventory screen, but the central result does not reverse. Across the tested minimums, between 86.1% and 92.0% of markets with lower asking prices still have higher modeled P&I.
Methodology
Data Sources
The calculations use two source families: Realtor.com® housing-market data and Freddie Mac mortgage-rate data.
1. Realtor.com Housing Data
The August 2025 and August 2026 housing observations come from Realtor.com Economic Research’s monthly metro-level housing inventory historical data. Fields used in the study are:
- median listing price;
- median listing price per square foot;
- median listing square footage;
- active listing count;
- quality flag;
- household rank;
- CBSA code; and
- market name.
The monthly file used here was updated September 2, 2026, with observations through August 2026. Realtor.com reports the geography using the 2023 Office of Management and Budget metropolitan and micropolitan delineations.
“Median asking price” in this article refers to Realtor.com median listing price for active listings. It is not a closed-sale price, appraisal, repeat-sales index or estimate of the value change for a constant home.
For readability, the study calls both metropolitan and micropolitan statistical areas “markets.”
2. Mortgage-Rate Benchmarks
The primary mortgage inputs are Freddie Mac Primary Mortgage Market Survey® 30-year fixed-rate averages:
- 6.95% as of September 17, 2026;
- 6.26% for the comparable week one year earlier; and
- 6.76% as of September 10, 2026, for the one-week sensitivity comparison.
Freddie Mac states that PMMS is calculated from purchase applications that satisfy its survey criteria. Those criteria include conventional, single-family originations within conforming loan limits set by the Federal Housing Finance Agency.
The weekly observation is an average of loan rates offered from Thursday through Wednesday. The September 17 publication therefore covers the week ending September 16. The Federal Reserve released its September policy decision on September 16, so most applications contributing to that weekly average were submitted before the announcement. This study does not claim that the Fed’s September action caused the 6.95% PMMS reading.
The housing and rate inputs are deliberately matched as “latest complete monthly housing data” and “latest weekly mortgage-rate benchmark,” not as measurements from the same calendar month.
Markets Included in the Analysis
There are 925 source markets with the required observations in both Augusts. The primary sample contains 494.
The exclusions are:
- 156 markets with a Realtor.com quality flag in August 2025, August 2026 or both; and
- 275 additional unflagged markets with fewer than 200 active listings in at least one of the two months.
Realtor.com describes the quality flag as an indicator for values falling outside a market’s typical range. The study removes any market flagged in either comparison month before calculating the headline findings.
The active-listing rule is a second, separate screen. It is intended to reduce sensitivity to thin inventory; it is not a statistical confidence threshold. The cutoff-sensitivity analysis above shows the results using no minimum and minimums of 100, 150, 200, 250 and 300 active listings in both months.
Ninety-nine of the 100 largest markets in the source data remain in the 494-market sample. Toledo, Ohio, is excluded because it carries a Realtor.com® quality flag.
State-level counts include only markets wholly assigned to one state. Multi-state markets are omitted from state totals.
How the Mortgage Payment Was Modeled
Every market uses the same simplified financing assumptions:
- 20% down;
- 80% financed;
- 360 monthly payments;
- 6.26% applied to 80% of the August 2025 median asking price; and
- 6.95% applied to 80% of the August 2026 median asking price.
The headline payment measure is principal and interest only. It does not include:
- property taxes;
- homeowners insurance;
- mortgage insurance;
- HOA dues;
- closing costs;
- mortgage points;
- maintenance; or
- seller concessions.
PMMS is a national conforming-market benchmark. For comparability, the same PMMS rate is applied to every market in this study. The model does not determine whether the resulting 80%-LTV loan amount in an individual market would be standard conforming, high-balance conforming or jumbo/nonconforming under the applicable local loan limit. The result is therefore a standardized comparison, not a mortgage quote.
For each market:
Year-ago modeled P&I = 80% of the August 2025 median asking price amortized for 360 months at 6.26%.
Current modeled P&I = 80% of the August 2026 median asking price amortized for 360 months at 6.95%.
A market reaches break-even when current modeled P&I is less than or equal to its year-ago modeled P&I.
How the 6.89% Break-Even Was Calculated
For a fixed mortgage rate and term, monthly P&I scales directly with principal. The standard amortization equation is:
Monthly P&I = P × [r(1 + r)ⁿ] ÷ [(1 + r)ⁿ − 1]
where:
- P is mortgage principal;
- r is the annual mortgage rate divided by 12; and
- n is 360.
The break-even asking-price ratio can therefore be calculated from the payment factor at each rate:
Break-even asking-price change = payment factor at 6.26% ÷ payment factor at 6.95% – 1
= -6.8858%, rounded to -6.89%.
That means the modeled purchase price must be about 6.89% lower for P&I at 6.95% to equal P&I on the year-ago price at 6.26%.
Because the same down-payment percentage is used in both periods, the 80% financing share cancels from the break-even ratio. Changing the down payment would change the dollar payments, but not the percentage price decline required under the same down-payment percentage in each period.
Price-per-Square-Foot Test
The median asking price can move because listing prices change, because the mix of active listings changes, or because both happen at once. To test whether the signal survives a second price measure, the analysis applies the same -6.89% threshold to the year-over-year change in median listing price per square foot.
This is not a matched-home or repeat-sales test. Median asking price and median price per square foot are separate medians, and price per square foot can itself vary with the size and type of homes listed.
The study therefore reports three counts:
- markets clearing break-even on median asking price;
- markets clearing break-even on median price per square foot; and
- markets clearing it on both measures.
The overlap is treated as a conservative robustness check, not as the definitive count of markets where a constant-quality home became cheap enough to offset the mortgage-rate increase.
Mortgage-Rate Sensitivity
To show how much the conclusion depends on the weekly mortgage benchmark, the August housing data are held fixed while the current rate is varied. The year-ago rate remains 6.26%.
| Current mortgage rate | Asking-price decline needed for P&I break-even | Markets clearing break-even | Share of 494 markets |
|---|---|---|---|
| 6.50% | 2.48% | 150 | 30.4% |
| 6.76% | 5.07% | 57 | 11.5% |
| 6.95% | 6.89% | 22 | 4.5% |
| 7.00% | 7.36% | 19 | 3.8% |
| 7.25% | 9.65% | 4 | 0.8% |
Only 6.76% and 6.95% are observed Freddie Mac weekly rates used in the study. The other rate levels are illustrative sensitivity cases, not forecasts.
The 6.76%-to-6.95% comparison is particularly useful because the housing data are identical. A 19-basis-point rate move changes the break-even from -5.07% to -6.89% and reduces the qualifying market count from 57 to 22.
Secondary Housing-Cost Check
The headline intentionally isolates P&I. A separate sensitivity adds two price-proportional housing-cost assumptions:
- annual property tax equal to 1.1% of the asking price; and
- annual homeowners insurance equal to 0.5% of the asking price.
The 1.1% and 0.5% inputs are illustrative standardized assumptions used only to test how adding price-linked non-P&I costs changes the break-even calculation. They are not presented as U.S. averages or as estimates for any particular metro.
Under those assumptions, the required asking-price decline falls from 6.89% to 5.50%. The number of markets reaching the threshold increases:
- from 22 to 49 using median asking price;
- from 12 to 20 using median price per square foot; and
- from 4 to 7 using both measures.
These results should not be read as estimates of actual all-in ownership costs. Property-tax bills depend on assessment practices and local tax rules. Homeowners-insurance premiums depend on location, property characteristics, coverage choices and insurer pricing, and neither cost necessarily moves one-for-one with asking price.
Limitations
- The study measures asking prices, not completed-sale prices: Realtor.com median listing price describes active inventory. It is not a closed-sale median, appraisal series or repeat-sales home-price index.
- Listing mix can change the median: A market can show a lower median asking price because smaller or less expensive homes make up a larger share of active inventory. Median listing size declined in 295 of the 494 markets.
- The housing comparison uses two points in time: August 2025 and August 2026 are compared directly. The analysis does not describe the path between those months or prove an ongoing trend.
- Housing and mortgage inputs have different frequencies and dates: Asking-price inputs are monthly August observations; the current mortgage benchmark is Freddie Mac’s weekly average as of September 17. The study intentionally combines the latest complete monthly housing file with the latest weekly mortgage-rate reading.
- The rate is a national conforming-market benchmark: PMMS reflects qualifying purchase applications under Freddie Mac’s criteria, including conventional single-family originations within FHFA conforming loan limits. Actual borrower rates vary, and the model applies PMMS uniformly even where an individual market’s modeled loan amount may not align with the applicable conforming limit.
- The weekly rate materially changes the result: Holding the housing data fixed, moving the benchmark from 6.76% to 6.95% reduces the number of break-even markets from 57 to 22.
- The headline payment excludes non-P&I costs: Taxes, insurance, mortgage insurance, HOA dues, points, closing costs, maintenance and other ownership expenses are omitted from the headline calculation.
- A market median does not describe every buyer or property: Results apply to a modeled loan based on the median active asking price, not to every transaction, borrower or mortgage in the market.
- The quality and inventory screens reduce, but cannot eliminate, volatility: The 200-listing rule is a reporting screen rather than a statistical confidence interval. Alternative minimums produce different exact counts, although the central result remains in the same direction.
Finally, national totals in this article are counts of markets. They are not weighted by population, households, active listings, sales volume or mortgage originations.
Technical Notes and Replicability
Definitions
| Term | Definition |
|---|---|
| Median asking price | Realtor.com median listing price for a market in August 2025 or August 2026 |
| Primary analysis | 494 markets with no Realtor.com quality flag in either comparison month and at least 200 active listings in both months |
| Year-ago mortgage rate | Freddie Mac 30-year fixed PMMS average of 6.26% for the comparable year-ago week |
| Current mortgage rate | Freddie Mac 30-year fixed PMMS average of 6.95% as of September 17, 2026 |
| Modeled P&I | Monthly principal and interest on 80% of the market’s median asking price over 360 months |
| Payment factor | Monthly P&I per $1 of principal at a specified mortgage rate and term |
| Break-even asking-price decline | The asking-price change at which current modeled P&I equals year-ago modeled P&I; approximately -6.89% |
| Cleared break-even | The exact unrounded asking-price decline is sufficient for current modeled P&I to be at or below the year-ago modeled amount |
| Price-per-square-foot test | Applying the same break-even threshold to the year-over-year change in median listing price per square foot |
| Quality flag | Realtor.com indicator that a market value falls outside its typical range |
| Rank within zone | The ordinal position inside a zone after sorting by Realtor.com household rank |
Aggregation and Ranking Approach
Every market receives equal weight in national counts. A market with 200 active listings contributes one observation, as does a market with tens of thousands of listings.
For that reason, percentages in this article describe shares of included markets. They should not be interpreted as shares of U.S. households, active listings, homebuyers, transactions or mortgage borrowers.
Realtor.com® household rank is used to order markets by size. Within each zone, that household-rank ordering is retained, but the displayed rank runs from 1 through the number of markets in that zone. State statistics count only markets entirely within one state; multi-state markets are not assigned to a state total.
Quality-Control Steps
The analysis team:
- verified that all 925 source markets contain both August 2025 and August 2026 observations;
- checked that CBSA codes are unique in the source;
- excluded every market with a Realtor.com® quality flag in either comparison month before calculating the primary results;
- verified that every primary-sample market has at least 200 active listings in both months;
- recalculated monthly P&I for every market with the standard fixed-rate amortization formula;
- confirmed that the five outcome zones sum to 494 markets;
- recalculated all published percentages from unrounded counts;
- tested every break-even classification using the exact unrounded asking-price change;
- repeated the break-even test on median price per square foot;
- reran the national calculations on the 769-market unflagged universe and all 925 source markets;
- reran the unflagged sample using 100-, 150-, 200-, 250- and 300-listing minimums;
- recalculated the results under the selected mortgage-rate sensitivity cases;
- independently checked the tax-and-insurance sensitivity calculation;
- checked the major-market and state-level examples against the underlying market records; and
- verified the 6.95%, 6.76% and 6.26% mortgage-rate observations, the Thursday-through-Wednesday PMMS window and the published PMMS eligibility criteria against Freddie Mac.
Displayed numbers are rounded only after the calculations and classifications are completed.
Replicability
To rebuild the primary analysis:
- Obtain Realtor.com Economic Research’s historical monthly metro housing inventory data.
- Keep August 2025 and August 2026 and match the two months by CBSA code.
- Exclude markets with a Realtor.com® quality flag in either month.
- Exclude the remaining markets unless each has at least 200 active listings in both months.
- Calculate the exact year-over-year change in median listing price.
- Model P&I on 80% of the August 2025 median asking price over 360 months at 6.26%.
- Model P&I on 80% of the August 2026 median asking price over 360 months at 6.95%.
- Classify a market as reaching break-even when current modeled P&I is less than or equal to year-ago modeled P&I.
For the listing-composition check, apply the -6.89% break-even threshold to the exact year-over-year change in median listing price per square foot.
For inventory-screen sensitivity, repeat the sample construction using minimum active-listing thresholds of 100, 150, 250 and 300 in both months while continuing to exclude quality-flagged observations.
Notes
- Unless a section says otherwise, all headline figures use the 494-market primary sample.
- Percentages are calculated from unrounded counts and may not sum to exactly 100.0% after display rounding.
- Zone tables are ordered by Realtor.com household rank, but the displayed rank is rank within the zone.
- State counts include only single-state markets.
- Full market-level records, formulas and sensitivity outputs are available from contact@ziffy.ai.
About Ziffy
Ziffy is an AI-native real estate investment platform that helps investors discover, analyze and finance U.S. real estate opportunities. The platform combines property search, investment analysis and access to specialized financing solutions, including DSCR, fix-and-flip and bridge loans. This research was produced by Ziffy’s data analytics team to provide transparency into housing, lodging, and affordability trends.