


Editorial Integrity
Making sound real estate investment decisions begins with reliable, data-driven insights. At Ziffy.ai, we offer an AI-native real estate investing, proprietary data-driven trend analysis, investment mortgage programs like DSCR loans, and a network of over 500 investor-friendly real estate agents to deliver the expertise needed for informed decisions. Our content is crafted by experienced real estate professionals and backed by real-time market data, ensuring you receive accurate and actionable information. Through a rigorous editorial process, we strive to empower your investment journey with trustworthy and up-to-date guidance.
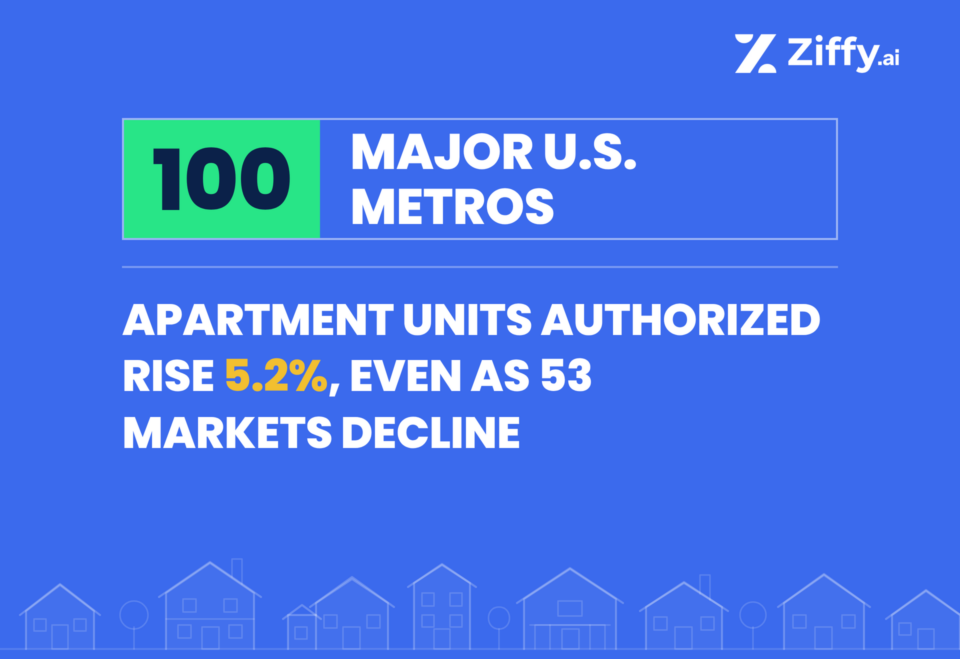
Apartment-unit authorizations increased 5.2% across the 100 largest U.S. metropolitan areas during January–September 2026 compared with the same period in 2025, even as 53 metros recorded declines.
The growth was heavily concentrated: New York, Los Angeles, Washington, D.C., and Seattle added a combined 27,913 authorized units, while the remaining 96 metros recorded a net decline of 13,908 units.
Meanwhile, single-family authorizations fell 4.7%, and total housing-unit authorizations declined 1.4%.
Ziffy’s analysis of U.S. Census Bureau Building Permits Survey data shows that growth in a handful of major metros masked weaker apartment permitting activity across much of the study group.
For this analysis, apartment permits refer to housing units authorized in buildings containing five or more units, including rental apartments and condominiums. The figures measure authorized housing units, not individual permit documents or completed construction.
Table of Contents
Four metros added 27,913 apartment-unit authorizations, while the remaining 96 recorded a combined decline of 13,908
New York, Los Angeles, Washington, D.C., and Seattle accounted for nearly twice the overall net increase of 14,005 authorized units across the 100 largest U.S. metros.
Single-family authorizations fell 4.7% while apartment authorizations increased 5.2%
Despite the increase in larger residential buildings, total housing-unit authorizations declined 1.4%. Apartments’ share of all authorized units increased from 35.4% to 37.8%.
Orlando recorded the largest absolute decline in apartment-unit authorizations, losing 5,860 units
Orlando’s apartment authorizations fell 55.7% year over year, from 10,524 to 4,664 units. Houston followed with a decline of 3,867 units, while Columbus, Ohio, recorded 3,134 fewer.
Four Metros Added 27,913 Apartment-Unit Authorizations, While the Remaining 96 Recorded a Combined Decline of 13,908
Apartment-unit authorizations increased by 14,005, or 5.2%, across the 100 largest U.S. metros during January-September 2026. But the increase was concentrated in four markets: New York, Los Angeles, Washington, D.C., and Seattle.
Together, those four metros added 27,913 authorized apartment units, nearly twice the overall net increase across all 100 markets. The remaining 96 metros recorded a combined decline of 13,908 units, or 6.1%, as losses in some markets outweighed gains in others.
Metropolitan Area | Jan-Sep 2025 | Jan-Sep 2026 | Change |
|---|---|---|---|
New York, NY-NJ | 21,429 | 32,968 | +11,539 |
Los Angeles, CA | 8,441 | 15,913 | +7,472 |
Washington, DC-VA-MD-WV | 6,002 | 10,667 | +4,665 |
Seattle, WA | 4,835 | 9,072 | +4,237 |
Four metros combined | 40,707 | 68,620 | +27,913 |
Other 96 metros combined | 226,980 | 213,072 | −13,908 |
All 100 metros | 267,687 | 281,692 | +14,005 |
The four metros accounted for 48.4% of all positive metro-level apartment authorization gains before declines elsewhere were subtracted.
This concentration explains why the aggregate increase does not reflect the experience of most markets. Of the 100 metros analyzed, 53 recorded declines, 46 experienced increases, and one remained unchanged.
The results indicate that the increase in authorized apartment units was concentrated geographically rather than broadly shared across the country’s largest metropolitan markets.
Apartment Permit Statistics [100 U.S. Metros Analyzed]
1. Apartment Authorizations Increased 5.2% Across Major U.S. Metros Even as Single-Family Authorizations Fell 4.7%
The 100 largest U.S. metropolitan areas authorized 281,692 housing units in buildings with five or more units during January-September 2026, up from 267,687 during the same period in 2025. That represents an increase of 14,005 units.
Single-family authorizations moved in the opposite direction, falling by 21,545 units, from 459,497 to 437,952. Authorizations in buildings containing two to four units declined by another 2,798. These reductions more than offset the increase in apartment-unit authorizations, resulting in an overall decline in housing units authorized across the 100 largest metros.
Housing category | Jan-Sep 2025 | Jan-Sep 2026 | Change |
|---|---|---|---|
Buildings with 5+ units | 267,687 | 281,692 | +5.2% |
Single-family buildings | 459,497 | 437,952 | -4.7% |
Buildings with 2-4 units | 28,200 | 25,402 | -9.9% |
All housing units | 755,384 | 745,046 | -1.4% |
Despite the increase in apartment-unit authorizations, total housing authorizations fell by 10,338 units, or 1.4%, as declines in other building categories outweighed the gains.

Amresh Singh
Apartment permits increased, but total housing authorizations still fell. That’s an important distinction. More units were approved in larger buildings, while fewer were approved in single-family homes. Looking at only the overall permit count would miss that difference.
2. More Than Half of the 100 Largest U.S. Metros Recorded Apartment Authorization Declines, With a Median Drop of 6.5%
Apartment-unit authorizations declined in 53 metropolitan areas during January-September 2026 compared with the same period in 2025. Another 46 metros recorded increases, while one remained unchanged.
The median metro-level percentage change was a decline of 6.5% among the 98 markets with a positive 2025 baseline. Among the 86 metros that authorized at least 300 units in buildings with five or more homes in 2025, the median decline was 7.5%.
These results contrast with the 5.2% aggregate increase across all 100 metros. The aggregate measures the change in combined authorized units, giving larger markets greater influence, while the median identifies the midpoint of individual metro percentage changes.
3. Apartments Accounted for 37.8% of Authorized Housing Units in 2026, Up From 33.0% in 2024
Units in buildings containing five or more homes represented 37.81% of all housing units authorized across the 100 largest metros during January-September 2026, compared with 35.44% in 2025 and approximately 32.97% in 2024.
The apartment share increased by 2.37 percentage points in one year and approximately 4.84 percentage points over the two-year comparison. The change reflects both rising apartment-unit authorizations and declining authorizations in other housing categories.
Between 2024 and 2026, authorizations in buildings containing five or more units increased 8.3%, while single-family authorizations declined 12.5%. Total housing-unit authorizations fell 5.6% over the same period. The rising apartment share therefore reflects both an increase in units authorized in larger buildings and a reduction in other residential building categories. It does not, by itself, establish that developers shifted projects from single-family homes to apartment buildings.
4. Los Angeles Apartment Authorizations Jumped 88.5% in One Year, Adding 7,472 Units
Los Angeles-Long Beach-Anaheim authorized 15,913 housing units in buildings with five or more homes during January-September 2026, up from 8,441 during the same period in 2025.
The increase of 7,472 units was the second-largest absolute gain among the 100 metros, behind New York’s 11,539-unit increase. Unlike New York, where the latest increase followed a weaker 2025 comparison, Los Angeles’ growth was similarly substantial relative to 2024.
The metro authorized 8,385 apartment units in January-September 2024, meaning its 2026 total was 89.8% higher. The share of all authorized housing units in buildings with five or more homes also increased from 43.2% in 2025 to 59.1% in 2026.
5. Orlando Recorded the Largest Numerical Decline in Apartment Authorizations, Losing 5,860 Units in One Year
Orlando-Kissimmee-Sanford, Florida, recorded the largest absolute decline in apartment-unit authorizations among the 100 largest U.S. metros during January-September 2026. The metro authorized 4,664 units in buildings containing five or more homes, down from 10,524 during the same period in 2025. That represents a reduction of 5,860 authorized units, or 55.7%.
Orlando’s 2026 total was also 1,908 units below its January-September 2024 figure of 6,572, showing that authorizations remained below their level two years earlier.
Houston recorded the second-largest numerical decline, losing 3,867 authorized units, followed by Columbus, Ohio, with a reduction of 3,134 units. Together, these three metros recorded 12,861 fewer apartment-unit authorizations than a year earlier, offsetting a substantial portion of the gains in New York, Los Angeles, Washington, D.C., and Seattle.
6. Dallas, Houston and Austin Combined Recorded 7,843 Fewer Apartment-Unit Authorizations in 2026
Three major Texas metropolitan areas experienced substantial declines in authorized housing units in buildings with five or more homes during January-September 2026. Houston-Pasadena-The Woodlands recorded the largest decline among the three, falling 35.2%, followed by Austin-Round Rock-San Marcos at 21.3% and Dallas-Fort Worth-Arlington at 12.3%.
Metropolitan Area | Jan-Sep 2025 | Jan-Sep 2026 | Change |
|---|---|---|---|
Houston, TX | 10,975 | 7,108 | -35.2% |
Austin, TX | 7,758 | 6,102 | -21.3% |
Dallas-Fort Worth, TX | 18,871 | 16,551 | -12.3% |
Combined | 37,604 | 29,761 | -20.9% |
Together, Dallas-Fort Worth, Houston, and Austin authorized 7,843 fewer apartment units than during January-September 2025, a combined decline of 20.9%. These three metros contributed substantially to the decline in apartment-unit authorizations among the Southern markets included in the study. The figures represent these three metropolitan areas only, not a statewide total for Texas.
7. Apartment Authorizations Rose 33.1% Across Northeastern Metros in the Study but Fell 7.1% Across Southern Metros
Apartment-unit authorizations moved in different directions across the regional groups represented in Ziffy’s analysis of the 100 largest U.S. metros. The 16 Northeastern metros authorized 51,198 housing units in buildings containing five or more homes during January-September 2026, up from 38,474 during the same period in 2025. That represents an increase of 12,724 units, or 33.1%.
By contrast, the 42 Southern metros included in the study recorded 122,507 apartment-unit authorizations, down from 131,854 a year earlier. That represents a decline of 9,347 units, or 7.1%. These results describe the selected metropolitan areas within each regional group, rather than all housing authorizations across the corresponding Census regions.
Region | Metros | Jan-Sep 2025 | Jan-Sep 2026 | Change |
|---|---|---|---|---|
Northeast | 16 | 38,474 | 51,198 | +33.1% |
West | 24 | 61,025 | 69,574 | +14.0% |
Midwest | 18 | 36,334 | 38,413 | +5.7% |
South | 42 | 131,854 | 122,507 | -7.1% |
New York accounted for 11,539 of the Northeast’s 12,724 additional authorized units, representing 90.7% of the regional increase. Only seven of the 16 Northeastern metros recorded individual gains.
The Midwest showed a different pattern. Eleven of its 18 metros recorded increases, although the region’s combined growth was a comparatively modest 2,079 units.
In the South, 17 of 42 metros experienced increases, but declines in Orlando, Houston, Dallas–Fort Worth, and Austin outweighed gains in many other markets.
Note: Regional figures cover only the metropolitan areas included in this study, not all housing authorizations across each Census region. Each metro is assigned to one region based on the study’s geographic classification, including metropolitan areas that cross state boundaries.
8. Twenty-One U.S. Metros Increased Apartment Authorizations While Single-Family Authorizations Declined
Twenty-one of the 100 largest U.S. metros recorded increases in apartment-unit authorizations alongside declines in single-family authorizations during January–September 2026 compared with the same period in 2025.
To qualify, metros needed to have authorized at least 300 units in buildings containing five or more homes and at least 500 single-family units during the 2025 comparison period.
The qualifying markets included New York, Washington, Seattle, Atlanta, Charlotte, Philadelphia, Indianapolis, and Durham. Thirteen were among the 50 largest U.S. metros by population, while 12 were classified within the South.
Some markets recorded substantial differences between the two building categories.
Charlotte authorized 1,115 additional apartment units while single-family authorizations declined by 3,436 units. Durham added 2,194 apartment units while authorizing 649 fewer single-family units.
However, the size of these changes varied considerably across the 21 markets. In St. Louis, single-family authorizations declined by just nine units, while Tucson recorded a reduction of eight.
The classification identifies metros where the two building categories moved in opposite directions. It does not establish that developers shifted projects from single-family housing to apartments, nor does it imply that every qualifying metro experienced a substantial change in construction activity.
9. Durham Apartment Authorizations Increased 119%, With Larger Buildings Accounting for 61.1% of All Authorized Units
Durham-Chapel Hill, North Carolina, authorized 4,038 housing units in buildings with five or more homes during January-September 2026, up from 1,844 during the same period in 2025. The increase of 2,194 units was the fifth-largest absolute gain among the 100 largest metros.
Durham also recorded the largest increase in the apartment share of total housing authorizations among markets meeting the study’s 300-unit baseline requirement. Its share increased from 36.0% in 2025 to 61.1% in 2026, a gain of 25.1 percentage points. The metro’s 2026 apartment authorization total was also substantially above its January-September 2024 figure of 707 units, indicating that the latest increase was not simply a return to its earlier level.
10. Apartment Authorizations Remained Below 2024 Levels in 45 Major U.S. Metros Despite an 8.3% Aggregate Increase
Across the 100 largest metros, apartment-unit authorizations increased from 260,098 during January-September 2024 to 281,692 during the same period in 2026. The two-year increase of 21,594 units, or 8.3%, was larger than the 5.2% increase recorded between 2025 and 2026.
However, 45 of the 100 metros still authorized fewer units in buildings with five or more homes than they had in 2024. The longer comparison also changes the concentration finding. New York, Los Angeles, Washington and Seattle added 27,913 apartment-unit authorizations relative to 2025, but their combined increase compared with 2024 was 15,083 units.
Meanwhile, the remaining 96 metros recorded a combined decline of 13,908 units relative to 2025 but were still 6,511 units above their 2024 level.

Debjit Saha
The comparison year changes the story quite a bit. New York had a large increase from 2025, but its 2026 total was only modestly higher than in 2024. Los Angeles looks very different because its increase holds up against both earlier years. Looking at all three periods helps separate those situations.
Metros With the Largest Increases in Apartment-Unit Authorizations
New York recorded the largest increase in apartment-unit authorizations among the 100 largest U.S. metros during January–September 2026, adding 11,539 units compared with the same period in 2025.
Los Angeles followed with 7,472 additional authorized units, while Washington, D.C., and Seattle added 4,665 and 4,237 units, respectively.
The ten metros with the largest absolute increases collectively added 39,060 apartment-unit authorizations year over year. However, declines in other markets offset much of those gains, leaving a net increase of 14,005 units across all 100 metros.
The table below ranks markets by the number of additional authorized apartment units, rather than percentage growth.
Rank | Metropolitan area | 2025 units | 2026 units | Change |
|---|---|---|---|---|
1 | New York-Newark-Jersey City, NY-NJ | 21,429 | 32,968 | +11,539 |
2 | Washington-Arlington-Alexandria, DC-VA-MD-WV | 8,441 | 15,913 | +7,472 |
3 | Seattle-Tacoma-Bellevue, WA | 6,002 | 10,667 | +4,665 |
4 | Durham-Chapel Hill, NC | 4,835 | 9,072 | +4,237 |
5 | Los Angeles-Long Beach-Anaheim, CA | 1,844 | 4,038 | +2,194 |
6 | Boston-Cambridge-Newton, MA-NH | 3,921 | 6,050 | +2,129 |
7 | Kansas City, MO-KS | 3,186 | 5,063 | +1,877 |
8 | San Francisco-Oakland-Fremont, CA | 3,250 | 5,100 | +1,850 |
9 | Philadelphia-Camden-Wilmington, PA-NJ-DE-MD | 3,206 | 4,769 | +1,563 |
10 | Indianapolis-Carmel-Greenwood, IN | 1,472 | 3,006 | +1,534 |
Note: Ranked by absolute change in housing units authorized in buildings with five or more units. All 100 metros are eligible.
Metros With the Largest Declines in Apartment-Unit Authorizations
Orlando, Houston and Columbus recorded the largest absolute reductions. Orlando’s decline of 5,860 units exceeded the drop in any other metropolitan area in the study.
Rank | Metropolitan area | 2025 units | 2026 units | Change |
|---|---|---|---|---|
1 | Orlando-Kissimmee-Sanford, FL | 10,524 | 4,664 | -5,860 |
2 | Houston-Pasadena-The Woodlands, TX | 10,975 | 7,108 | -3,867 |
3 | Columbus, OH | 8,129 | 4,995 | -3,134 |
4 | Riverside-San Bernardino-Ontario, CA | 4,660 | 2,210 | -2,450 |
5 | Dallas-Fort Worth-Arlington, TX | 18,871 | 16,551 | -2,320 |
6 | Austin-Round Rock-San Marcos, TX | 7,758 | 6,102 | -1,656 |
7 | Nashville-Davidson-Murfreesboro-Franklin, TN | 4,401 | 2,908 | -1,493 |
8 | Bridgeport-Stamford-Danbury, CT | 2,117 | 674 | -1,443 |
9 | North Port-Bradenton-Sarasota, FL | 3,651 | 2,253 | -1,398 |
10 | Las Vegas-Henderson-North Las Vegas, NV | 2,807 | 1,427 | -1,380 |
Note: All 100 metros are eligible. Rankings use absolute changes, not percentage declines.
Metros With the Largest Percentage Increases in Apartment Authorizations (Minimum 300 Units in 2025)
Columbia, South Carolina, recorded the largest percentage increase in apartment-unit authorizations among metros that authorized at least 300 units in buildings containing five or more homes during January-September 2025.
Columbia’s authorizations increased 181.7%, from 635 to 1,789 units. Virginia Beach followed with a 153.6% increase, while Cleveland recorded growth of 144.5%.
Of the 100 metros analyzed, 86 met the minimum 300-unit requirement used for this percentage-growth ranking.
The threshold limits the influence of extremely small starting values. Without it, Memphis would lead with a 2,846.3% increase, from just 41 units in 2025 to 1,208 in 2026.
The ranking therefore highlights percentage growth among markets with a meaningful prior-year authorization base rather than markets recording unusually large percentage changes from very small totals.
Rank | Metropolitan area | 2025 units | 2026 units | Increase |
|---|---|---|---|---|
1 | Columbia, SC | 635 | 1,789 | +181.7% |
2 | Virginia Beach-Chesapeake-Norfolk, VA-NC | 601 | 1,524 | +153.6% |
3 | Cleveland, OH | 301 | 736 | +144.5% |
4 | Durham-Chapel Hill, NC | 1,844 | 4,038 | +119.0% |
5 | Indianapolis-Carmel-Greenwood, IN | 1,472 | 3,006 | +104.2% |
6 | Hartford-West Hartford-East Hartford, CT | 402 | 786 | +95.5% |
7 | St. Louis, MO-IL | 1,007 | 1,945 | +93.1% |
8 | Los Angeles-Long Beach-Anaheim, CA | 8,441 | 15,913 | +88.5% |
9 | Seattle-Tacoma-Bellevue, WA | 4,835 | 9,072 | +87.6% |
10 | Washington-Arlington-Alexandria, DC-VA-MD-WV | 6,002 | 10,667 | +77.7% |
Twenty-One Metros Increased Apartment Authorizations While Reducing Single-Family Authorizations
The following 21 metros recorded year-over-year increases in housing units authorized in buildings containing five or more homes alongside declines in single-family authorizations during January–September 2026.
Each market met the study’s minimum 2025 baseline requirements of 300 apartment-unit authorizations and 500 single-family authorizations.
The table ranks qualifying metros by their absolute increase in apartment-unit authorizations.
The differences in building-type activity were not equally substantial across all 21 metros. Charlotte recorded a particularly large reduction in single-family authorizations, while several others experienced only minor declines.
These figures establish the direction and magnitude of changes in authorized housing units. They do not demonstrate that the same builders transferred development activity from one building type to another.
Rank | Metropolitan area | Change in 5+ units | Change in single-family units |
|---|---|---|---|
1 | New York-Newark-Jersey City, NY-NJ | +11,539 | -1,704 |
2 | Washington-Arlington-Alexandria, DC-VA-MD-WV | +4,665 | -482 |
3 | Seattle-Tacoma-Bellevue, WA | +4,237 | -76 |
4 | Durham-Chapel Hill, NC | +2,194 | -649 |
5 | Philadelphia-Camden-Wilmington, PA-NJ-DE-MD | +1,563 | -953 |
6 | Indianapolis-Carmel-Greenwood, IN | +1,534 | -40 |
7 | Portland-Vancouver-Hillsboro, OR-WA | +1,162 | -360 |
8 | Columbia, SC | +1,154 | -207 |
9 | Richmond, VA | +1,134 | -122 |
10 | Atlanta-Sandy Springs-Roswell, GA | +1,124 | -963 |
11 | Charlotte-Concord-Gastonia, NC-SC | +1,115 | -3,436 |
12 | St. Louis, MO-IL | +938 | -9 |
13 | Sacramento-Roseville-Folsom, CA | +768 | -429 |
14 | Greensboro-High Point, NC | +514 | -173 |
15 | Knoxville, TN | +354 | -96 |
16 | Greenville-Anderson-Greer, SC | +252 | -70 |
17 | Milwaukee-Waukesha, WI | +219 | -91 |
18 | Birmingham, AL | +198 | -112 |
19 | Tucson, AZ | +83 | -8 |
20 | Tulsa, OK | +67 | -451 |
21 | McAllen-Edinburg-Mission, TX | +29 | -85 |
Note: Metros are ranked by their absolute increase in housing units authorized in buildings containing five or more units between January-September 2025 and the same period in 2026. All 21 metros also recorded declines in single-family authorizations and met the study’s minimum 2025 authorization thresholds of 300 units in buildings containing five or more homes and 500 single-family units. This classification identifies opposite directions of change; it does not establish that developers transferred projects between building types.
Regional Differences in Single-Family and Apartment Authorizations Across the 100 Largest U.S. Metros
Housing-unit authorizations moved in different directions across the four regional groups represented in the study. The Northeast and West recorded increases in apartment-unit authorizations alongside declines in single-family authorizations, while the South experienced decreases in both categories.
Among the 16 Northeastern metros, apartment authorizations increased 33.1%, while single-family authorizations fell 11.9%. The 24 Western metros recorded a similar contrast, with apartment authorizations rising 14.0% and single-family authorizations declining 6.6%.
In the 42 Southern metros, apartment-unit authorizations declined 7.1%, while single-family authorizations decreased 4.6%. These figures represent only the metropolitan areas selected for the study, not all housing authorizations within each Census region.
Region | 2025 single-family units | 2026 single-family units | Single-family change | Apartment change |
|---|---|---|---|---|
Northeast | 28,030 | 24,686 | -11.9% | +33.1% |
Midwest | 54,247 | 55,487 | +2.3% | +5.7% |
South | 277,361 | 264,505 | -4.6% | -7.1% |
West | 99,859 | 93,274 | -6.6% | +14.0% |
The 2024 Comparison Changes the Interpretation of 2026 Growth
The latest year-over-year results show a 5.2% increase in apartment-unit authorizations across the 100 largest metros, but the two-year comparison provides a different perspective.
Housing category | Jan-Sep 2024 | Jan-Sep 2025 | Jan-Sep 2026 | 2024-2026 change |
|---|---|---|---|---|
Buildings with 5+ units | 260,098 | 267,687 | 281,692 | +8.3% |
Single-family buildings | 500,759 | 459,497 | 437,952 | -12.5% |
Buildings with 2-4 units | 27,989 | 28,200 | 25,402 | -9.2% |
All authorized units | 788,846 | 755,384 | 745,046 | -5.6% |
Apartment authorizations were 8.3% above their January-September 2024 level, while single-family authorizations were 12.5% below it. Total authorized units were 5.6% below the 2024 comparison.
These three comparable year-to-date observations establish the direction and size of changes over the specified periods. They do not establish a permanent construction trend.
Methodology
Study Scope and Definitions
This study examines housing units authorized by building permits across the 100 largest U.S. metropolitan statistical areas, selected using the U.S. Census Bureau’s July 1, 2025 population estimates. It compares cumulative January-September authorization figures for 2024, 2025, and 2026.
The analysis uses unadjusted, year-to-date authorization counts from the Census Bureau’s Building Permits Survey, rather than seasonally adjusted annualized rates. Comparisons are made between equivalent nine-month periods.
For this study, apartment permits refers to housing units authorized in residential buildings containing five or more units, including rental apartments and condominiums. The study separates housing authorizations into three categories:
- Single-family: Units authorized in one-unit residential buildings.
- Two-to-four-unit buildings: Units authorized in buildings containing two to four residences.
- Apartment buildings: Units authorized in buildings containing five or more residences.
Total housing-unit authorizations include all three categories.
The figures count authorized housing units, not individual permit documents, construction starts, completed homes, or units available for occupancy. A single building permit may authorize multiple residential units.
The findings describe authorization activity within the selected 100 metropolitan areas, not the entire United States. Changes in authorizations do not establish why construction activity increased or decreased, whether authorized projects will be completed, or how housing supply will ultimately change.
Data Sources
This analysis uses three primary data inputs.
1. Housing units authorized by building type
The U.S. Census Bureau Building Permits Survey supplied metropolitan-level housing-unit authorization data for January-September 2024, 2025 and 2026.
The study uses cumulative year-to-date figures from each year’s September release. The data distinguish between housing units authorized in:
- Single-family buildings;
- Two-unit buildings;
- Buildings containing three or four units;
- Buildings containing five or more units; and
- All residential buildings combined.
The primary apartment measure is the number of housing units authorized in buildings containing five or more units. This includes rental apartments, condominiums and other qualifying residential buildings. Buildings containing two to four units are reported separately and are not included in the apartment category.
The data count authorized housing units, not individual permit documents. A single authorization for a large residential building may cover dozens or hundreds of units.
Authorizations indicate that construction has been permitted, not that construction has started, been completed or resulted in occupied housing.
The analysis uses January-September cumulative figures rather than full-calendar-year totals. The September year-to-date records may incorporate Census revisions and late reporting, so they should not be assumed to equal the sum of separately published monthly observations.
The source records were accessed on October 23, 2026, for the 2024 and 2025 data, and October 27, 2026, for the 2026 data. The September 2026 metropolitan release was recorded as published on October 27, 2026.
2. Metropolitan population estimates
The U.S. Census Bureau’s Vintage 2025 metropolitan population estimates supplied the July 1, 2025 resident population figures used to identify the 100 largest U.S. metropolitan statistical areas.
The study ranked all 387 metropolitan statistical areas in the population reference by their estimated 2025 population and selected the 100 largest.
Population determines which metros enter the analysis and their population rankings. It does not determine the weight assigned to their housing-unit authorizations in aggregate calculations.
The population records were accessed on October 23, 2026.
3. Metropolitan geographic definitions
Metropolitan statistical area definitions and county membership came from the July 2023 Office of Management and Budget metropolitan delineation, available through the Census Bureau metropolitan delineation reference files.
The analysis uses five-digit Core Based Statistical Area (CBSA) codes to identify and match metropolitan areas across population and building-permit records.
The geographic reference was used to maintain consistent metropolitan definitions and verify county membership.
Metropolitan names were standardized for presentation where necessary. Name differences did not determine the underlying geographic match.
The geographic reference data were accessed on October 23, 2026.
Metros Included in the Analysis
The study selected the 100 largest metropolitan statistical areas using the Census Bureau’s Vintage 2025 population estimates. Metropolitan areas were selected based on population, rather than apartment construction activity or growth rates.
The 100 selected metros were matched across the 2024, 2025, and 2026 Building Permits Survey datasets using five-digit Core Based Statistical Area (CBSA) identifiers. All 100 metros have corresponding January-September housing-unit authorization observations for each year.
The analysis excludes metropolitan areas outside the population-based top 100, nonmetropolitan areas, and authorizations outside the selected metro boundaries.
All 100 metros contribute to aggregate totals, regional comparisons, and counts of markets with increasing or decreasing authorizations. Minimum baseline thresholds apply only to specified percentage-growth rankings and directional classifications, as explained in the methodology below.
How Apartment Authorization Changes Were Calculated
The primary comparison measures changes between January-September 2025 and January-September 2026.
For each metro:
Absolute unit change = 2026 authorized units – 2025 authorized units
Percentage change = (2026 authorized units – 2025 authorized units) ÷ 2025 authorized units × 100
The same calculations are applied separately to apartment-unit authorizations, single-family authorizations and total housing-unit authorizations.
Percentage changes are calculated only when the comparison-year authorization count is greater than zero.
For combined results across the 100 metros:
Aggregate percentage change = Sum of metro-level unit changes ÷ Sum of 2025 authorized units × 100
The aggregate percentage change is calculated from combined authorized housing units, not by averaging the percentage changes of individual metros.
For example, the 100 largest metros recorded 267,687 five-or-more-unit authorizations during January–September 2025 and 281,692 during the same period in 2026.
The increase of 14,005 authorized units represents aggregate growth of 5.2%.
The calculation gives greater influence to metros with larger authorization volumes. It does not indicate that most individual metros experienced growth.
How Apartment Shares Were Calculated
The apartment share measures the percentage of all authorized housing units located in buildings containing five or more residential units.
For each metro:
Apartment share = Five-or-more-unit authorizations ÷ Total housing-unit authorizations × 100
The calculation includes all residential building-size categories in the denominator.
The change in apartment share is measured in percentage points:
Apartment-share change = 2026 apartment share – 2025 apartment share
Across the 100 largest metros, five-or-more-unit authorizations accounted for approximately 35.44% of total authorized units during January-September 2025 and 37.81% in 2026.
That represents an increase of 2.37 percentage points.
The analysis also compares the 2026 apartment share with the corresponding 2024 figure.
An increase in apartment share can result from higher apartment-unit authorizations, lower authorizations in other building categories, or a combination of both.
A higher share does not necessarily indicate that the absolute number of apartment units authorized increased.
How Metropolitan Growth and Decline Counts Were Calculated
Each metro was classified by the direction of its five-or-more-unit authorization change between January-September 2025 and January-September 2026.
| Classification | Definition |
|---|---|
| Apartment authorizations increased | 2026 authorized units exceed the 2025 total |
| Apartment authorizations declined | 2026 authorized units are below the 2025 total |
| Apartment authorizations unchanged | The 2026 and 2025 totals are equal |
The classification includes all 100 metros, without a minimum authorization threshold.
The analysis identified 46 metros with increasing apartment-unit authorizations, 53 with declining authorizations and one with no change.
These are counts of metropolitan areas, not population-weighted, household-weighted or permit-volume-weighted estimates.
The study also calculated the median metro-level percentage change.
The median is the middle value after the eligible metro percentage changes are arranged from lowest to highest. It gives each qualifying metro equal weight, regardless of population or permit volume.
Among the 98 metros with a positive apartment authorization baseline in 2025, the median change was a decline of 6.5%. Two metros, Stockton and Toledo, recorded no five-or-more-unit authorizations in the 2025 comparison period and are excluded from the median.
When the analysis is restricted to metros with at least 300 apartment-unit authorizations in 2025, the median change was a decline of 7.5%.
These medians are reported separately from the aggregate 5.2% increase because they measure different aspects of the distribution.
How the Concentration of Apartment Authorization Growth Was Calculated
To measure whether the aggregate increase was broadly distributed or concentrated in a few metropolitan areas, the study ranked all 100 metros by their absolute change in five-or-more-unit authorizations.
New York, Los Angeles, Washington, D.C., and Seattle recorded the four largest absolute increases between January-September 2025 and January–September 2026.
Their combined increase was calculated as:
Four-metro increase = 11,539 + 7,472 + 4,665 + 4,237 = 27,913 units
The other 96 metros’ combined change was calculated by subtracting the four-metro increase from the 100-metro net change:
Remaining 96-metro change = 14,005 – 27,913 = -13,908 units
The remaining 96 metros therefore experienced a combined net decline of 13,908 authorized units.
This does not mean all 96 individual metros recorded declines. Some experienced increases, but their gains were outweighed by decreases elsewhere.
The study uses two separate concentration measures.
Contribution to net growth = Four-metro increase ÷ Total net increase across 100 metros × 100
The four leading metros’ combined increase represented 199.3% of the 100-metro net gain.
This figure exceeds 100% because reductions in other metropolitan areas offset part of the gains.
Share of gross positive gains = Four-metro increase ÷ Sum of all positive metro-level changes × 100
The 46 metros with increasing apartment authorizations collectively recorded 57,629 additional authorized units before the declines in other metros were deducted.
The four leading metros accounted for 48.4% of those gross positive gains.
The report distinguishes gross positive gains from net growth and does not use the two denominators interchangeably.
How Metropolitan Rankings Were Calculated
The analysis uses separate ranking methods for absolute unit changes and percentage changes.
Absolute-change rankings include all 100 metropolitan areas, regardless of authorization volume.
Metros are ranked by the difference between their 2026 and 2025 five-or-more-unit authorization totals.
The largest-increase ranking identifies markets that authorized the greatest number of additional units.
The largest-decline ranking identifies markets that authorized the greatest number of fewer units.
Percentage-growth rankings use a minimum of 300 five-or-more-unit authorizations during January-September 2025.
Eighty-six metros meet this requirement.
The minimum is intended to reduce the influence of unusually small starting values, which can produce very large percentage changes from relatively modest increases in authorized units.
For example, Memphis increased from 41 five-or-more-unit authorizations in January-September 2025 to 1,208 in 2026.
Its increase is included in the overall totals and absolute-change calculations, but Memphis is excluded from the thresholded percentage-growth ranking.
The 300-unit threshold is a study-specific reporting rule, not a Census Bureau classification or a formal statistical significance test.
Where ranking values are tied, population rank is used to determine their order.
How Pivot Metros Were Identified
The analysis identifies metros where five-or-more-unit authorizations increased while single-family authorizations declined.
A metro qualifies for the primary pivot classification only if it meets all four conditions:
- At least 300 housing units authorized in buildings with five or more units during January-September 2025.
- At least 500 single-family housing units authorized during January-September 2025.
- An increase in five-or-more-unit authorizations from 2025 to 2026.
- A decline in single-family authorizations over the same period.
Twenty-one metros satisfy all four requirements.
Thirteen of those metros are among the 50 largest by population.
Without the two authorization-volume thresholds, 27 metros meet the directional criteria. Twenty-six of those have a positive 2025 five-or-more-unit baseline.
The thresholds are intended to distinguish the primary reported group from markets with limited comparison-year authorization activity.
The pivot classification describes opposite directions of change in two building-size categories. It does not demonstrate that developers converted single-family projects into apartment projects or that construction activity shifted for a particular economic reason.
How Regional Comparisons Were Calculated
The 100 metropolitan areas were grouped into the Northeast, Midwest, South and West.
Each metro was assigned to the Census region associated with the first state in its published metropolitan name.
When a metropolitan area extends across multiple states, the entire metro is assigned to one regional grouping. Its authorization counts are not divided between states.
For example, Washington-Arlington-Alexandria is included in the South under the study’s classification convention.
The study includes:
| Region | Number of metros |
|---|---|
| Northeast | 16 |
| Midwest | 18 |
| South | 42 |
| West | 24 |
| Total | 100 |
For each region, the analysis calculates the combined number of five-or-more-unit authorizations, single-family authorizations and total authorized housing units.
Regional percentage changes are calculated from the combined unit counts, not by averaging the percentage changes of individual metros.
The study also examines how many metros within each grouping experienced increases or declines.
These regional results are aggregates of selected metropolitan areas. They are not equivalent to the Census Bureau’s separately published regional permit totals, which cover a broader geographic universe.
How the 2024 Comparison Was Used
The principal analysis compares January-September 2026 with the same period in 2025.
January-September 2024 provides an additional comparison to assess whether 2026 authorization levels exceeded or remained below an earlier observation.
For each metro:
Two-year unit change = 2026 authorized units – 2024 authorized units
Two-year percentage change = (2026 authorized units – 2024 authorized units) ÷ 2024 authorized units × 100
Percentage changes are calculated only when the 2024 baseline is positive.
The study uses this comparison to identify markets where an increase from 2025 may primarily reflect a lower comparison-year total.
For example, New York recorded a substantial increase in apartment-unit authorizations from 2025 to 2026, but its 2026 total was only 5.5% above the January-September 2024 level.
Los Angeles recorded a much larger two-year increase of 89.8%.
The analysis also compares the four largest 2025-2026 growth contributors with the remaining 96 metros using 2024 as the baseline.
The three observation years provide comparable year-to-date measurements. They do not establish a long-term construction trend or identify the causes of changes.
Data Verification and Reproducibility
Ziffy analyzed metropolitan-level housing-unit authorization data from the U.S. Census Bureau’s Building Permits Survey, matching observations for January–September 2024, 2025, and 2026 using five-digit CBSA identifiers.
The analysis includes checks for duplicate metro identifiers, missing observations, consistency between individual building-type categories and overall housing-unit totals, and agreement between calculated changes and the published rankings.
Absolute changes were calculated from underlying authorization counts, while percentage changes were calculated before rounding. Aggregate and regional percentage changes were derived from combined authorized-unit totals rather than averages of individual metro growth rates.
The research workbook preserves the selected metropolitan areas, underlying observations, calculations, ranking criteria, geographic reference information, and documented source checks to support independent review.
The results reflect the Census data vintages identified in the Data Sources section. Because the Census Bureau may revise previously published authorization figures, later downloads may produce different values.
The documented checks establish internal consistency and agreement with the source comparisons recorded in the research workbook. They should not be interpreted as independent authentication of every original Census source file.
Limitations
Authorizations are not completed construction: Building-permit data measure authorized housing units, not construction starts, completed apartments or occupied homes.
Apartment authorizations are not exclusively rental apartments: The five-or-more-unit building category may include condominiums and other ownership housing.
Housing units are not permit documents: One building permit can authorize multiple residential units. The analysis measures the number of units authorized, not the number of permits issued.
Limited geographic coverage: The study includes the 100 largest U.S. metropolitan areas by July 2025 population. It does not represent every U.S. metro, nonmetropolitan area or the country as a whole.
Year-to-date comparisons: The analysis uses January-September cumulative totals. These are not full-calendar-year construction figures, and no annualized projections are made.
Potential data revisions: Census building-permit records may be updated to reflect late reporting, corrections or revised information. Subsequent releases may differ from the figures used in this study.
Small comparison-year baselines: Percentage changes can be unusually large when the initial authorization count is low. Minimum thresholds reduce this issue in specified rankings but do not eliminate all volatility.
Aggregate results may conceal local differences: Large metros have greater influence on combined authorization totals. Aggregate growth does not establish that most individual metros experienced increases.
Median and aggregate changes measure different things: The aggregate measures total unit change relative to the combined baseline. The median measures the midpoint of individual metro percentage changes.
Regional grouping convention: Multi-state metros are assigned entirely to one region using the first state in their published name. Alternative geographic allocation methods could produce different regional totals.
No property-level or project-level information: The analysis does not identify individual buildings, developers, development costs, planned rents, sale prices or construction schedules.
No direct measure of future housing supply: An increase in authorized units does not guarantee that every project will proceed to construction or reach completion.
No causal analysis: The study does not establish that mortgage rates, financing conditions, construction costs, zoning regulations, housing demand or local policies caused the observed changes.
Limited historical period: Three comparable January-September observations are insufficient to establish a sustained construction cycle or permanent shift in development patterns.
Technical Notes and Replicability
Definitions
| Term | Definition |
|---|---|
| Metropolitan statistical area (MSA) | A geographic area defined using federal metropolitan delineations |
| CBSA code | Five-digit identifier used to match metropolitan population, geography and permit records |
| Study universe | The 100 largest U.S. metropolitan statistical areas by July 1, 2025 resident population |
| Apartment-unit authorizations | Housing units authorized in buildings containing five or more residential units |
| Single-family authorizations | Housing units authorized in buildings containing one residential unit |
| Two-to-four-unit authorizations | Housing units authorized in buildings containing two, three or four units |
| Total housing-unit authorizations | Combined authorized units across all residential building-size categories |
| Primary comparison period | January-September 2026 versus January-September 2025 |
| Context period | January-September 2024 |
| Absolute unit change | Difference between the 2026 and 2025 authorization totals |
| Percentage change | Absolute unit change divided by the 2025 baseline, multiplied by 100 |
| Apartment share | Five-or-more-unit authorizations divided by all authorized housing units |
| Percentage-point change | Arithmetic difference between two percentage shares |
| Aggregate growth | Percentage change calculated from combined authorized units across the relevant metros |
| Median metro change | Middle percentage change among eligible metropolitan areas |
| Gross positive gains | Sum of positive unit changes across metros that recorded increases |
| Net authorization change | Sum of all positive, negative and zero metro-level changes |
| Concentration measure | Contribution of selected metros to aggregate net change or gross positive gains |
| Pivot metro | Metro meeting both minimum volume requirements where apartment authorizations increased and single-family authorizations declined |
| Baseline eligibility threshold | Minimum comparison-year authorized-unit count used for specified analytical rankings |
Geographic Matching
Metropolitan population records and building-permit records were matched using CBSA codes.
The same CBSA identifiers were used across the three annual permit observations.
Metropolitan names were standardized for presentation where necessary, but textual name matching was not used as the principal method of establishing geographic correspondence.
The study uses July 2023 metropolitan delineations to maintain consistent geographic definitions.
The workbook’s geographic checks reconcile population estimates, metropolitan population ranks and county-membership counts for the selected 100 metros.
A complete metropolitan crosswalk, including CBSA identifiers and population ranks, can be supplied with the underlying research data.
Aggregation and Ranking Approach
The study distinguishes between counts of metropolitan areas and sums of authorized housing units.
National study-group authorization totals represent the sum of authorized units across the 100 selected metros.
Metro growth and decline counts assign one observation to each metropolitan area, regardless of size.
For example, the finding that 53 metros recorded declining apartment authorizations means that 53 of the 100 included metropolitan areas experienced a negative unit change. It does not mean that 53% of U.S. residents or housing units were located in markets with declining authorizations.
The median metro percentage change likewise treats eligible metros equally.
Rankings use the measure identified in each table: absolute increases, absolute declines, percentage increases, changes in apartment share, population rank or qualifying pivot status.
The principal percentage-growth ranking applies the 300-unit apartment authorization baseline. The pivot classification applies both the 300-unit apartment baseline and the 500-unit single-family baseline.
All headline authorization totals, overall metro direction counts and regional aggregations retain the complete 100-metro universe.
Quality-Control Steps
The research workbook documents checks of the source data, metropolitan universe and calculations.
The following checks were included in the analytical review:
- Confirmed that the study contains 100 distinct metropolitan areas selected by July 2025 population.
- Confirmed that each included metro has January-September permit observations for 2024, 2025 and 2026.
- Checked metropolitan identifiers, population ranks and geographic membership against the documented reference data.
- Reconciled the 300 metro-year permit records against the source values preserved in the workbook.
- Checked that building-size category counts sum to total housing-unit authorizations.
- Recalculated national study-group authorization totals for all three years.
- Recalculated absolute and percentage changes in apartment, single-family and total authorizations.
- Verified that metro growth, decline and unchanged counts sum to 100.
- Recalculated median metro-level changes using the stated eligibility rules.
- Verified the four leading metros’ combined increase, the remaining 96 metros’ combined change and the 100-metro net result.
- Distinguished net growth contributions from shares of gross positive gains.
- Recalculated apartment shares and percentage-point changes.
- Checked regional totals against the selected metros assigned to each grouping.
- Applied the 300-unit and 500-unit eligibility thresholds to the appropriate rankings and classifications.
- Verified the primary pivot count and its alternative unthresholded counts.
- Compared the principal 2026 results against the corresponding 2024 totals.
- Reviewed major local findings and rankings for consistency with their underlying metro records.
The workbook documents matching permit values for all 300 metro-year observations and matching population and geographic checks for the 100 selected metropolitan areas.
It also records digital checksums for the original source materials. Those original government source materials were not independently authenticated as separate files during this review. Accordingly, the documented source comparisons should be distinguished from a new independent verification of the original downloads.
Displayed percentages are rounded for readability. Calculations and rankings use the underlying unit counts rather than rounded percentages.
Replicability
To reproduce the principal analysis:
- Obtain the U.S. Census Bureau’s metropolitan building-permit data for January-September 2024, 2025 and 2026.
- Obtain July 1, 2025 metropolitan population estimates and identify the 100 largest metropolitan statistical areas.
- Use the July 2023 metropolitan geographic delineation to establish consistent CBSA identifiers and county membership.
- Match the selected metros to each year’s building-permit observations using CBSA codes.
- Extract authorized housing units for single-family buildings, two-unit buildings, three-to-four-unit buildings, five-or-more-unit buildings and all buildings combined.
- Calculate absolute and percentage changes between January-September 2025 and January-September 2026.
- Sum authorized units across all 100 metros to calculate aggregate totals and percentage changes.
- Count metros where five-or-more-unit authorizations increased, declined or remained unchanged.
- Calculate each eligible metro’s percentage change and the median metro-level change.
- Rank all 100 metros by absolute apartment authorization increases and declines.
- Apply the 300-unit 2025 apartment authorization floor when calculating the percentage-growth ranking.
- Identify the four largest absolute contributors and calculate the combined change across the remaining 96 metros.
- Separately calculate the four leaders’ contribution to net growth and their share of gross positive gains.
- Calculate each metro’s five-or-more-unit share of total authorized housing units and its percentage-point change.
- Apply both the 300-unit apartment and 500-unit single-family baselines when identifying qualifying pivot metros.
- Assign metros to regions using the first state in their published names and calculate regional aggregates.
- Repeat the relevant comparisons using January-September 2024 as the earlier baseline.
- Reconcile aggregate totals, classifications, rankings and reported percentages against the underlying records.
The same geographic universe and building-size definitions should be retained across the three comparison years.
Notes
All national study-group findings refer to the 100 largest U.S. metropolitan statistical areas unless otherwise stated.
The terms apartment permits and apartment authorizations refer to housing units authorized in buildings containing five or more residential units.
Percentage-growth rankings use a minimum of 300 five-or-more-unit authorizations during January-September 2025.
Pivot-market findings require both 300 five-or-more-unit authorizations and 500 single-family authorizations in the 2025 baseline.
A metro with a zero comparison-year baseline remains in absolute-change and directional classifications, but no percentage change is calculated from that zero baseline.
Shares and percentage changes are rounded for publication. Small differences may occur when calculations are repeated using displayed rounded values.
The remaining 96 metros’ combined decline does not mean each individual metro recorded fewer apartment authorizations.
The 2024 comparison is included for historical context and does not establish a permanent construction trend.
Additional metropolitan records, ranking details and underlying research data are available upon request at contact@ziffy.ai.
About Ziffy
Ziffy is an AI-native real estate investment platform that helps investors discover, analyze, and finance U.S. real estate opportunities. The platform combines property search, investment analysis, and access to specialized financing solutions, including DSCR, fix-and-flip, and bridge loans. This research was produced by Ziffy’s data analytics team to provide transparency into housing, lodging, and affordability trends.