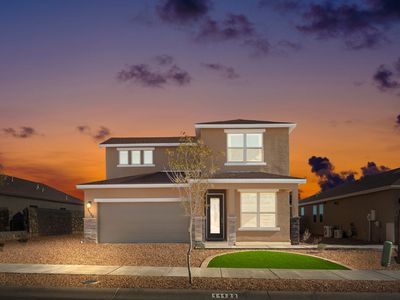
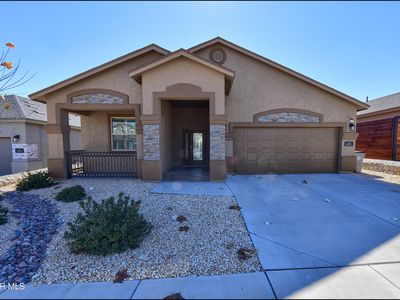
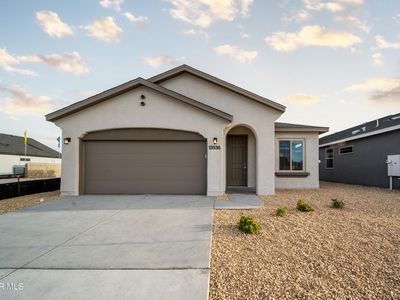
Texas Olive Plan, Painted DesertEl PasoTX79928

INVESTMENT ANALYSIS
Investment Verdict
Strong Cash FlowTexas Olive Plan, Painted Desert, El Paso, TX, 79928 in El Paso is a solid income-producing rental, 10.16% gross yield, $2,759/mo rent, $441/mo net cash flow on a $325,900 buy. DSCR 1.88 qualifies the property for Ziffy Mortgage's financing without personal income documentation. Five-year appreciation of $90,040 and $3,002/yr in principal reduction project a total cumulative return of $153,349.
| This Property | City Avg | |
|---|---|---|
| Gross Rental Yield | 10.2% | 5.8% |
| Monthly Cash Flow | $441 | $385 |
City averages based on El Paso market data in our database. Property projections are estimates.
DSCR Rental Loan Qualification
Qualifies using the property's rental income, not your personal income.
- ✓No W-2, pay stubs, or tax returns needed
- ✓Rental income qualifies you
- ✓Built for real estate investors
| Monthly Rental Income | $2,759 |
| Total Monthly Debt Service | $2,188 |
| DSCR Ratio | 1.26x |
Ziffy Mortgage: Your DSCR most likely meets our 1.0+ requirement, so you'll most probably qualify for our standard DSCR investment loan program. To pre-qualify, book time with your loan officer →
Estimates assume 6.0% rate / 30-yr fixed, 30% down, 1% tax, 0.5% insurance. Not a commitment to lend.
Single Family
Built in 2025
N/A lot
$N/A/sqft
No HOA
Neighborhood Data
Neighborhood data shown for ZIP Code: 79928, El Paso, TX area.
Housing Distribution
Housing Statistics
| Category | Value |
|---|---|
| Total HU (Housing Units) | 29,805 (100%) |
| Owner Occupied HU | 24,286 (81.5%) |
| Renter Occupied HU | 3,857 (12.9%) |
| Vacant Housing Units | 1,662 ( 5.6%) |
| Median Home Value | $235,364 |
| Average Home Value | $255,668 |
Housing Distribution
Address Breakdown
Residential
29,615
Single Family
29,615
Multi-Family
0
Businesses
766


Nearby investment properties with comparable rents
Nearby investment properties with comparable prices

Ziffy AI Summary
A quick, investor-focused snapshot highlighting income strength, yield potential.
| Key metrics | Value |
|---|---|
| Price | $399,900 |
| Est. Rent | $3,200/mo |
| ROI | 18% |
- Attractive rent-to-price ratio for income stability
- Good fit for DSCR financing with healthy coverage
Single Family
Built in 2025
N/A lot
$N/A/sqft
No HOA
Neighborhood Data
Neighborhood data shown for ZIP Code: 79928, El Paso, TX area.
Housing Distribution
Housing Statistics
| Category | Value |
|---|---|
| Total HU (Housing Units) | 29,805 (100%) |
| Owner Occupied HU | 24,286 (81.5%) |
| Renter Occupied HU | 3,857 (12.9%) |
| Vacant Housing Units | 1,662 ( 5.6%) |
| Median Home Value | $235,364 |
| Average Home Value | $255,668 |
Housing Distribution
Address Breakdown
Residential
29,615
Single Family
29,615
Multi-Family
0
Businesses
766
Nearby investment properties with comparable rents
Nearby investment properties with comparable prices
