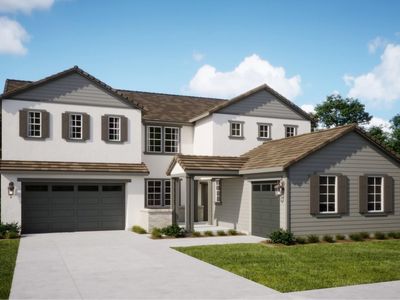
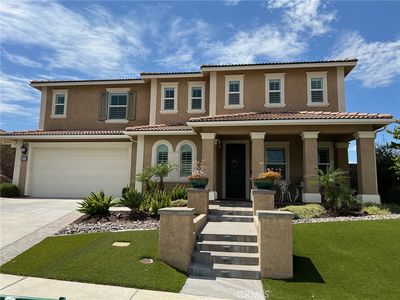
Monarch 3 Plan, North River Farms : MonarchOceansideCA92057
INVESTMENT ANALYSIS
Investment Verdict
Appreciation PlayYield and appreciation often trade off, and at Monarch 3 Plan, North River Farms: Monarch, Oceanside, CA, 92057 in Oceanside the bet is firmly on appreciation. Rental yield 0%. The 0% gross yield on a $1,514,900 price is below income-first thresholds, but 5%/yr value growth projects $418,539 in equity by year five. Ziffy Mortgage's non-U.S. DSCR mortgage (0.00) finances the acquisition on rental income alone. A larger down payment (30–35%) reduces monthly debt service and tightens the spread.
| This Property | City Avg | |
|---|---|---|
| Gross Rental Yield | 0% | 5.1% |
| Monthly Cash Flow | $0 | $1,200 |
City averages based on Oceanside market data in our database. Property projections are estimates.
Single Family
Built in N/A
N/A lot
$N/A/sqft
No HOA
Neighborhood Data
Neighborhood data shown for ZIP Code: 92057, Oceanside, CA area.
Housing Distribution
Housing Statistics
| Category | Value |
|---|---|
| Total HU (Housing Units) | 20,327 (100%) |
| Owner Occupied HU | 13,437 (66.1%) |
| Renter Occupied HU | 6,049 (29.8%) |
| Vacant Housing Units | 841 ( 4.1%) |
| Median Home Value | $787,909 |
| Average Home Value | $801,460 |
Housing Distribution
Address Breakdown
Residential
19,670
Single Family
18,356
Multi-Family
1,314
Businesses
237


Nearby investment properties with comparable rents
No similar rental properties found nearby.
Nearby investment properties with comparable prices

Ziffy AI Summary
A quick, investor-focused snapshot highlighting income strength, yield potential.
| Key metrics | Value |
|---|---|
| Price | $399,900 |
| Est. Rent | $3,200/mo |
| ROI | 18% |
- Attractive rent-to-price ratio for income stability
- Good fit for DSCR financing with healthy coverage
Single Family
Built in N/A
N/A lot
$N/A/sqft
No HOA
Neighborhood Data
Neighborhood data shown for ZIP Code: 92057, Oceanside, CA area.
Housing Distribution
Housing Statistics
| Category | Value |
|---|---|
| Total HU (Housing Units) | 20,327 (100%) |
| Owner Occupied HU | 13,437 (66.1%) |
| Renter Occupied HU | 6,049 (29.8%) |
| Vacant Housing Units | 841 ( 4.1%) |
| Median Home Value | $787,909 |
| Average Home Value | $801,460 |
Housing Distribution
Address Breakdown
Residential
19,670
Single Family
18,356
Multi-Family
1,314
Businesses
237
Nearby investment properties with comparable rents
No similar rental properties found nearby.
Nearby investment properties with comparable prices
Listed by: N/A • N/A
Mls Name: undefined
Mls ID: #N/A