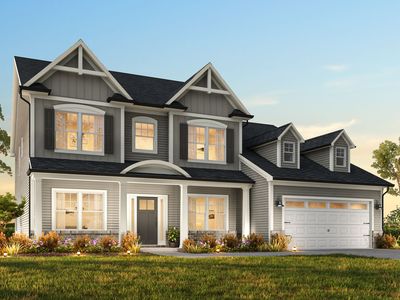
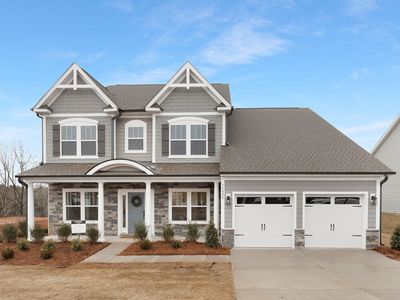
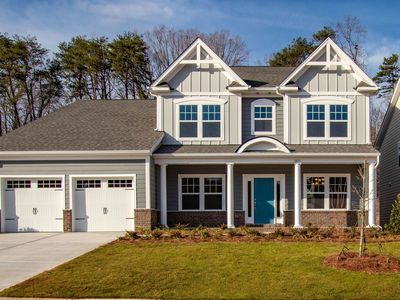
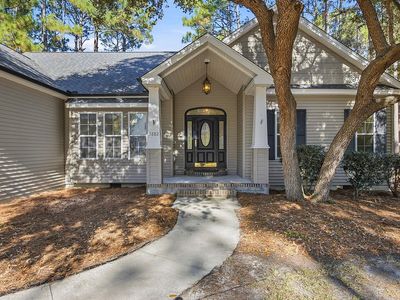
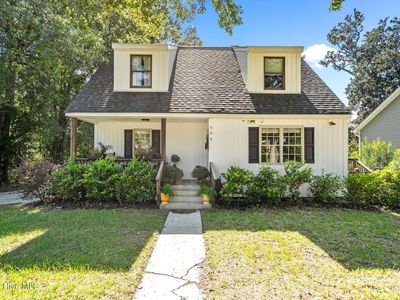
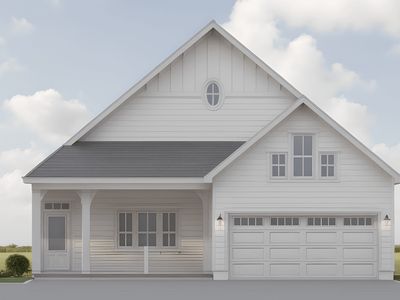
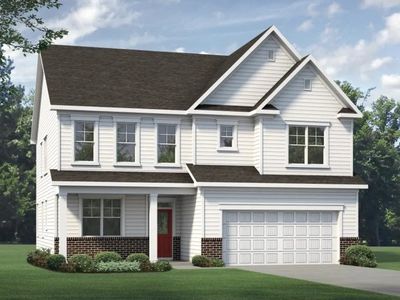
Kensington Plan, True Homes On Your Lot - WaterfordLelandNC28451
INVESTMENT ANALYSIS
Investment Verdict
Solid IncomeZiffy Mortgage's DSCR mortgage qualifies using the property's income alone, clearing approval without U.S. residency or credit. Five-year equity from $130,930 in appreciation and $4,365/yr in principal paydown projects total cumulative return of $225,384.
| This Property | National Avg | |
|---|---|---|
| Gross Rental Yield | 9.1% | 6.2% |
| Monthly Cash Flow | $713 | $180 |
National averages based on 2024–2025 U.S. residential rental market data. Content is user-generated and unverified.
DSCR Rental Loan Qualification
Qualifies using the property's rental income, not your personal income.
- ✓No W-2, pay stubs, or tax returns needed
- ✓Rental income qualifies you
- ✓Built for real estate investors
| Monthly Rental Income | $3,601 |
| Total Monthly Debt Service | $2,700 |
| DSCR Ratio | 1.33x |
Ziffy Mortgage: Your DSCR most likely meets our 1.0+ requirement, so you'll most probably qualify for our standard DSCR investment loan program. To pre-qualify, book time with your loan officer →
Estimates assume 6.0% rate / 30-yr fixed, 30% down, 1% tax, 0.5% insurance. Not a commitment to lend.
Single Family
Built in 2025
N/A lot
$N/A/sqft
No HOA
Neighborhood Data
Neighborhood data shown for ZIP Code: 28451, Leland, NC area.
Housing Distribution
Housing Statistics
| Category | Value |
|---|---|
| Total HU (Housing Units) | 23,676 (100%) |
| Owner Occupied HU | 15,987 (67.5%) |
| Renter Occupied HU | 5,229 (22.1%) |
| Vacant Housing Units | 2,460 (10.4%) |
| Median Home Value | $376,128 |
| Average Home Value | $424,214 |
Housing Distribution
Address Breakdown
Residential
22,396
Single Family
21,355
Multi-Family
1,041
Businesses
874


Nearby investment properties with comparable rents
Nearby investment properties with comparable prices

Ziffy AI Summary
A quick, investor-focused snapshot highlighting income strength, yield potential.
| Key metrics | Value |
|---|---|
| Price | $399,900 |
| Est. Rent | $3,200/mo |
| ROI | 18% |
- Attractive rent-to-price ratio for income stability
- Good fit for DSCR financing with healthy coverage
Single Family
Built in 2025
N/A lot
$N/A/sqft
No HOA
Neighborhood Data
Neighborhood data shown for ZIP Code: 28451, Leland, NC area.
Housing Distribution
Housing Statistics
| Category | Value |
|---|---|
| Total HU (Housing Units) | 23,676 (100%) |
| Owner Occupied HU | 15,987 (67.5%) |
| Renter Occupied HU | 5,229 (22.1%) |
| Vacant Housing Units | 2,460 (10.4%) |
| Median Home Value | $376,128 |
| Average Home Value | $424,214 |
Housing Distribution
Address Breakdown
Residential
22,396
Single Family
21,355
Multi-Family
1,041
Businesses
874
Nearby investment properties with comparable rents
Nearby investment properties with comparable prices
Listed by: N/A • True Homes
Mls Name: True Homes
Mls Provider:
Mls ID: #N/A