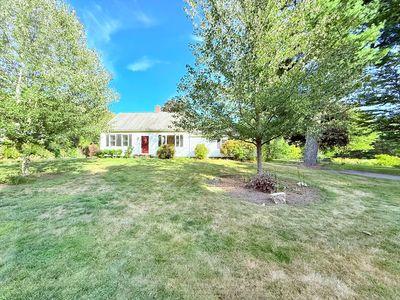
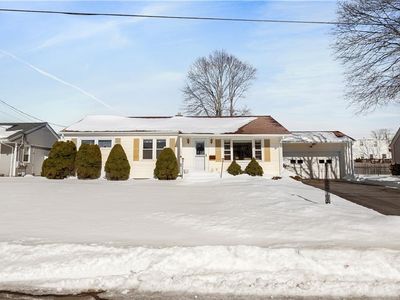
975 S Main StBellinghamMA02019
INVESTMENT ANALYSIS
Investment Verdict
Solid IncomeReliable, bankable, and well-priced, 975 S Main St, Bellingham, MA, 02019 in Bellingham delivers $3,684/mo in gross rent and $439/mo in net monthly income at a $514,900 entry. The 8.59% yield and 1.59 DSCR make it a clean candidate for Ziffy Mortgage's DSCR loan; no W-2s or U.S. credit history required. With 5% annual appreciation projecting $142,257 over five years and $4,742/yr in equity from loan paydown, total projected return is $223,740.
| This Property | City Avg | |
|---|---|---|
| Gross Rental Yield | 8.6% | 5.8% |
| Monthly Cash Flow | $439 | $850 |
City averages based on Bellingham market data in our database. Property projections are estimates.
DSCR Loan Qualification
| Monthly Rental Income | $3,684 |
| Total Monthly Debt Service | $3,040 |
| DSCR Ratio | 1.21x |
Ziffy Mortgage: Your DSCR most likely meets our 1.0+ requirement, so you'll most probably qualify for our standard DSCR investment loan program. To pre-qualify, book time with your loan officer →
Estimates assume 6.0% rate / 30-yr fixed, 30% down, 1% tax, 0.5% insurance. Not a commitment to lend.
Single Family
Built in 1971
0.69 Acres lot
$N/A/sqft
No HOA
Neighborhood Data
Neighborhood data shown for ZIP Code: 02019, Bellingham, MA area.
Housing Distribution
Housing Statistics
| Category | Value |
|---|---|
| Total HU (Housing Units) | 7,025 (100%) |
| Owner Occupied HU | 5,643 (80.3%) |
| Renter Occupied HU | 1,183 (16.8%) |
| Vacant Housing Units | 199 ( 2.8%) |
| Median Home Value | $551,091 |
| Average Home Value | $735,060 |
Housing Distribution
Address Breakdown
Residential
6,922
Single Family
6,450
Multi-Family
472
Businesses
541


Nearby investment properties with comparable rents
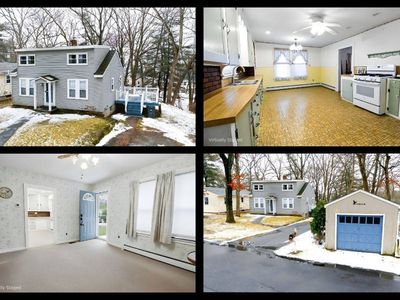
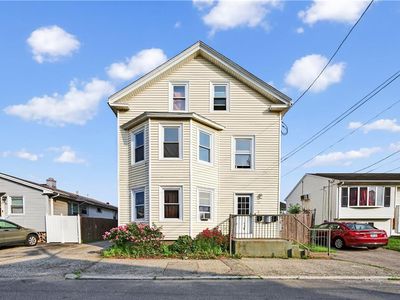
Nearby investment properties with comparable prices
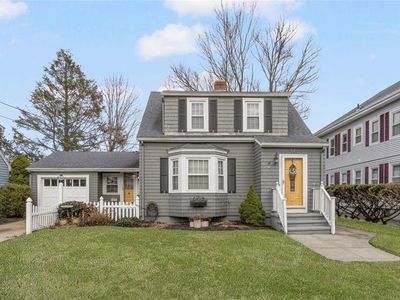


Ziffy AI Summary
A quick, investor-focused snapshot highlighting income strength, yield potential.
| Key metrics | Value |
|---|---|
| Price | $399,900 |
| Est. Rent | $3,200/mo |
| ROI | 18% |
- Attractive rent-to-price ratio for income stability
- Good fit for DSCR financing with healthy coverage
Single Family
Built in 1971
0.69 Acres lot
$N/A/sqft
No HOA
Neighborhood Data
Neighborhood data shown for ZIP Code: 02019, Bellingham, MA area.
Housing Distribution
Housing Statistics
| Category | Value |
|---|---|
| Total HU (Housing Units) | 7,025 (100%) |
| Owner Occupied HU | 5,643 (80.3%) |
| Renter Occupied HU | 1,183 (16.8%) |
| Vacant Housing Units | 199 ( 2.8%) |
| Median Home Value | $551,091 |
| Average Home Value | $735,060 |
Housing Distribution
Address Breakdown
Residential
6,922
Single Family
6,450
Multi-Family
472
Businesses
541
Nearby investment properties with comparable rents
Nearby investment properties with comparable prices
Listed by: Erin Herrick • MAssachusetts Real Estate Group
Mls Name: MLS PIN
Mls ID: #73430265