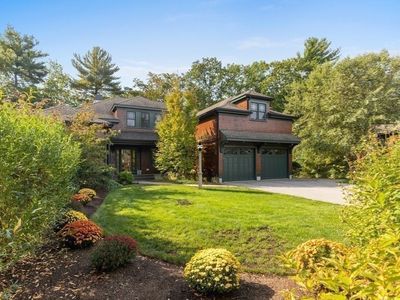
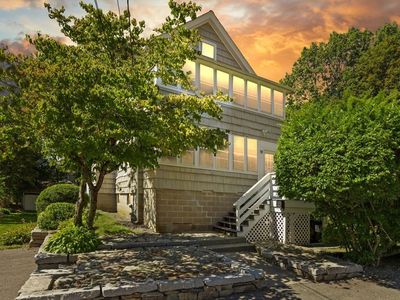
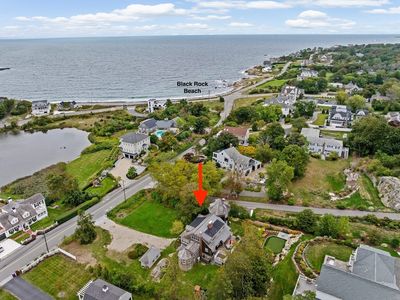
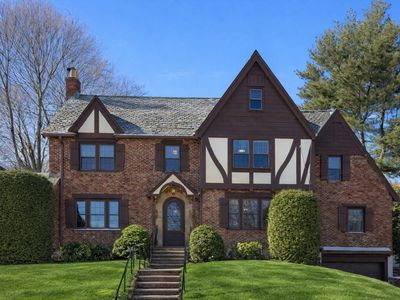
95 Black Rock DrHinghamMA02043
INVESTMENT ANALYSIS
Investment Verdict
Appreciation PlayInvestment property for sale in Hingham at 95 Black Rock Dr, Hingham, MA, 02043 projects strong ROI of 4.5%. Rental yield 2.44%. With 5% annual appreciation, the property builds $745,960 in value over five years. Equity growth combined delivers a projected five-year ROI of 37.08%, translating into $282,793 in total cumulative return on $762,750 invested capital. You can finance this property with Ziffy Mortgage’s DSCR loan, which leverages the property’s income for qualification rather than your personal income.
| This Property | City Avg | |
|---|---|---|
| Gross Rental Yield | 2.4% | 5.2% |
| Monthly Cash Flow | $(11,536) | $500 |
City averages based on Hingham market data in our database. Property projections are estimates.
DSCR Loan Qualification
| Monthly Rental Income | $5,482 |
| Total Monthly Debt Service | $15,943 |
| DSCR Ratio | 0.34x |
Ziffy Mortgage typically prefers a DSCR of 1.0+, but in some cases you may qualify with a DSCR below 1. To explore if this deal qualifies for an investment mortgage, book time with your loan officer →
Estimates assume 6.0% rate / 30-yr fixed, 30% down, 1% tax, 0.5% insurance. Not a commitment to lend.
Single Family
Built in 2014
N/A lot
$N/A/sqft
No HOA
Neighborhood Data
Neighborhood data shown for ZIP Code: 02043, Hingham, MA area.
Housing Distribution
Housing Statistics
| Category | Value |
|---|---|
| Total HU (Housing Units) | 10,276 (100%) |
| Owner Occupied HU | 7,412 (72.1%) |
| Renter Occupied HU | 2,102 (20.5%) |
| Vacant Housing Units | 762 ( 7.4%) |
| Median Home Value | $1,169,044 |
| Average Home Value | $1,240,940 |
Housing Distribution
Address Breakdown
Residential
9,851
Single Family
7,644
Multi-Family
2,207
Businesses
1,116


Nearby investment properties with comparable rents
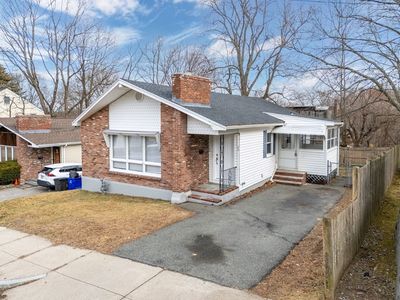
Nearby investment properties with comparable prices

Ziffy AI Summary
A quick, investor-focused snapshot highlighting income strength, yield potential.
| Key metrics | Value |
|---|---|
| Price | $399,900 |
| Est. Rent | $3,200/mo |
| ROI | 18% |
- Attractive rent-to-price ratio for income stability
- Good fit for DSCR financing with healthy coverage
Single Family
Built in 2014
N/A lot
$N/A/sqft
No HOA
Neighborhood Data
Neighborhood data shown for ZIP Code: 02043, Hingham, MA area.
Housing Distribution
Housing Statistics
| Category | Value |
|---|---|
| Total HU (Housing Units) | 10,276 (100%) |
| Owner Occupied HU | 7,412 (72.1%) |
| Renter Occupied HU | 2,102 (20.5%) |
| Vacant Housing Units | 762 ( 7.4%) |
| Median Home Value | $1,169,044 |
| Average Home Value | $1,240,940 |
Housing Distribution
Address Breakdown
Residential
9,851
Single Family
7,644
Multi-Family
2,207
Businesses
1,116
Nearby investment properties with comparable rents
Nearby investment properties with comparable prices
Listed by: Suzanne Troyer • Compass
Mls Name: MLS PIN
Mls ID: #73426373