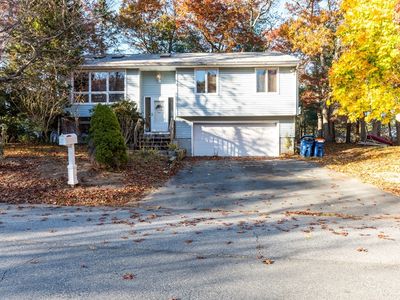
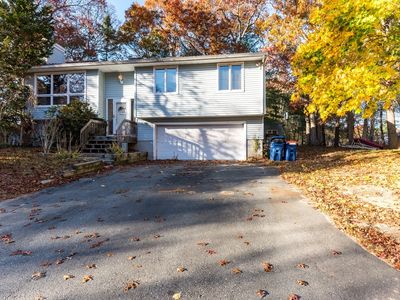
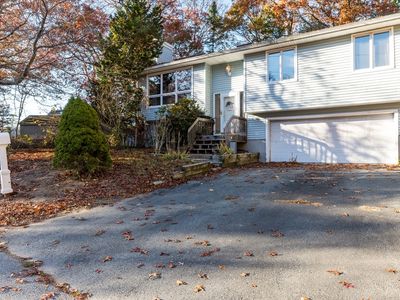
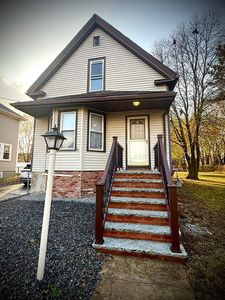
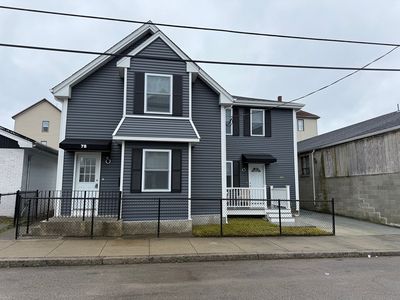
945 Sharon StNew BedfordMA02745
INVESTMENT ANALYSIS
Investment Verdict
Steady Equity BuilderThis is a cash-flow-light asset: 945 Sharon St, New Bedford, MA, 02745 in New Bedford, $479,999, 7.69% gross yield, $50/mo net income. Consider it a market-entry position, the $3,076/mo rent covers the $2,158/mo payment with a margin, and 5%/yr appreciation is projected to add $132,615 to the asset's value over five years. Ziffy Mortgage approves DSCR loans (coverage 1.43) for non-U.S. residents without domestic income documentation. Consider a higher down payment to widen the monthly margin. Total projected return: $185,519.
| This Property | City Avg | |
|---|---|---|
| Gross Rental Yield | 7.7% | 6.1% |
| Monthly Cash Flow | $50 | $420 |
City averages based on New Bedford market data in our database. Property projections are estimates.
DSCR Loan Qualification
| Monthly Rental Income | $3,076 |
| Total Monthly Debt Service | $2,834 |
| DSCR Ratio | 1.09x |
Ziffy Mortgage: Your DSCR most likely meets our 1.0+ requirement, so you'll most probably qualify for our standard DSCR investment loan program. To pre-qualify, book time with your loan officer →
Estimates assume 6.0% rate / 30-yr fixed, 30% down, 1% tax, 0.5% insurance. Not a commitment to lend.
Single Family
Built in 1990
8,285 sqft lot
$N/A/sqft
No HOA
Neighborhood Data
Neighborhood data shown for ZIP Code: 02745, New Bedford, MA area.
Housing Distribution
Housing Statistics
| Category | Value |
|---|---|
| Total HU (Housing Units) | 11,386 (100%) |
| Owner Occupied HU | 6,399 (56.2%) |
| Renter Occupied HU | 4,581 (40.2%) |
| Vacant Housing Units | 406 ( 3.6%) |
| Median Home Value | $401,117 |
| Average Home Value | $447,924 |
Housing Distribution
Address Breakdown
Residential
10,121
Single Family
9,164
Multi-Family
957
Businesses
752


Nearby investment properties with comparable rents
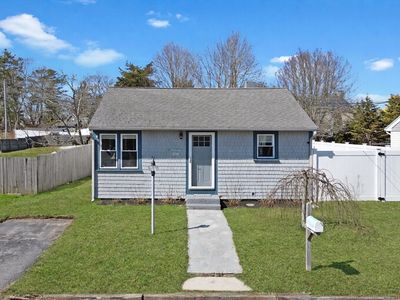
Nearby investment properties with comparable prices


Ziffy AI Summary
A quick, investor-focused snapshot highlighting income strength, yield potential.
| Key metrics | Value |
|---|---|
| Price | $399,900 |
| Est. Rent | $3,200/mo |
| ROI | 18% |
- Attractive rent-to-price ratio for income stability
- Good fit for DSCR financing with healthy coverage
Single Family
Built in 1990
8,285 sqft lot
$N/A/sqft
No HOA
Neighborhood Data
Neighborhood data shown for ZIP Code: 02745, New Bedford, MA area.
Housing Distribution
Housing Statistics
| Category | Value |
|---|---|
| Total HU (Housing Units) | 11,386 (100%) |
| Owner Occupied HU | 6,399 (56.2%) |
| Renter Occupied HU | 4,581 (40.2%) |
| Vacant Housing Units | 406 ( 3.6%) |
| Median Home Value | $401,117 |
| Average Home Value | $447,924 |
Housing Distribution
Address Breakdown
Residential
10,121
Single Family
9,164
Multi-Family
957
Businesses
752
Nearby investment properties with comparable rents
Nearby investment properties with comparable prices